Ninepoint Alternative Health Fund
January 2023 Commentary
Introduction
In this month’s commentary we review Q4 results from healthcare and consumer related equites that are part of the top ten holdings of the Ninepoint Alternative Health Fund portfolio. In addition, we examine announcements and discuss the implications on the US cannabis sector from state level ballot initiatives (Florida) and new state recreational market openings. We also examine recent MSO announcements related to operational changes in west coast states. We look at financial results of Canadian producers and discuss weakened Canadian cannabis performance, not because we are positive on the Canadian cannabis market but because we want investors to understand the difference between investing in the Canadian industry vs the US cannabis space. Finally, we review Canadian cannabis retail dispensary saturation and consider implications for further rationalization in 2023.
The Fund continues to outperform our benchmark as our active management, options strategy in addition to the combined elements of healthcare, pharmaceuticals, health and wellness and cannabis provide better risk adjusted returns than the passive ETFs.
January witnessed a significant rebound in tech related equites despite posting Q4 results that missed estimates while the healthcare sector did not take part in the 15% growth seen in the NASDAQ during the first 5 weeks of the year. It is important to note that the leading healthcare companies in the Fund announced Q4 financial results that beat estimates and provided positive guidance for 2023 whereas many mega tech companies announced weaker Q4 results with negative 23 guidance. When we consider the current economic environment, heightened fears of recession and sound fundamentals and catalysts the sector provides, we believe an to allocation to healthcare for 2023 is warranted.
US Cannabis Market Growth
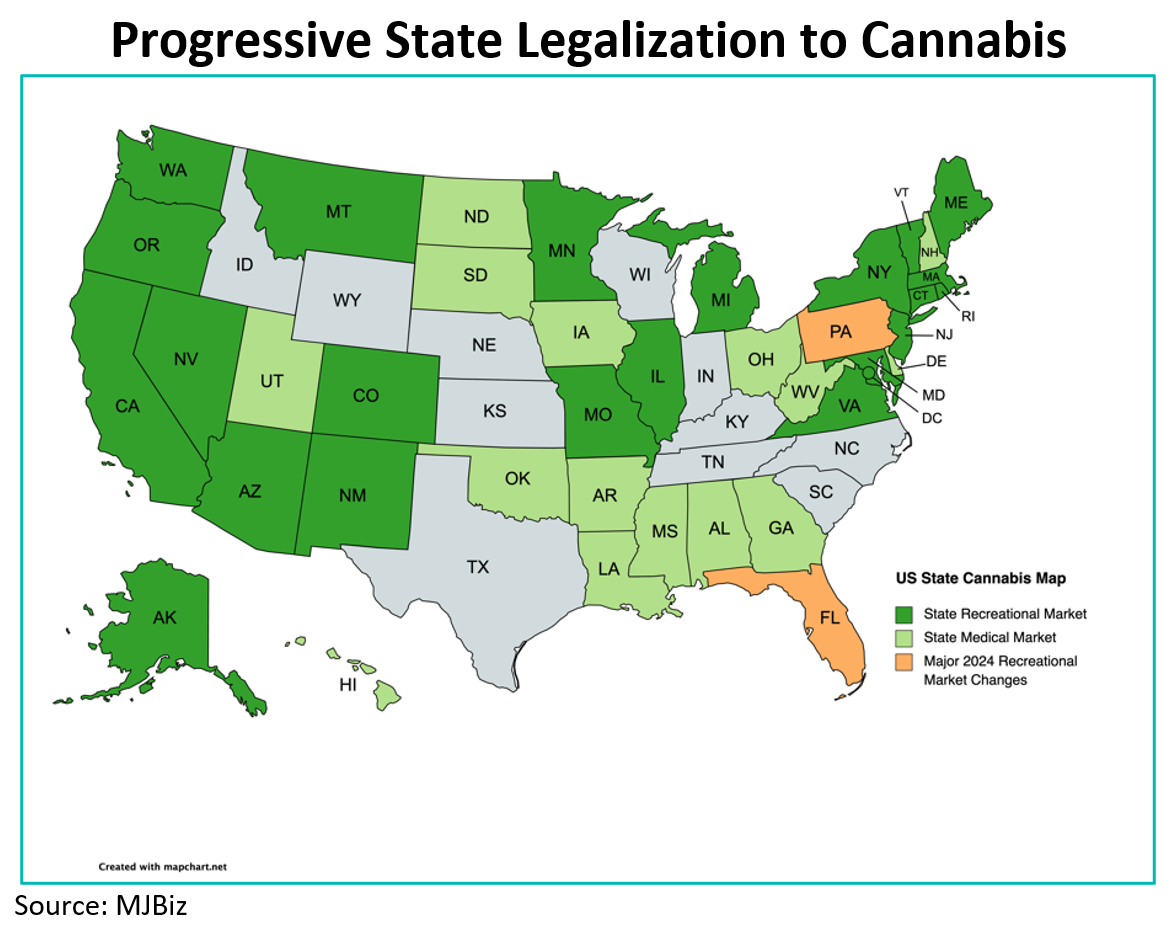
The total addressable market (TAM) for US cannabis continues to grow as both new medical markets open (GA, ND, SD) in addition to new recreational markets that further provide growth for those multi state operators that have exposure to those markets.
During 2022, New Jersey transitioned to recreational in April and provided state wide sales growth that exceeded expectations. Portfolio companies GTI, TER and VRNO have strong NJ operations and we see continued growth in NJ in 2023. The next state to offer significant growth for operators is MD where limited licensing and a strong tourism industry offers strong prospects for operators with scale. There is a limited number of cultivation and processing licenses (15 of each) and 100 dispensary licences. Portfolio companies GTI, TER, VRNO, TRUL all have cultivation, processing and dispensary licences. Once the market opens, the potential for MD suggests it can grow from its current estimated $450 million in medical sales in 2022 to a $2 billion recreational market at maturity. There are many state Governors and State Legislatures reviewing cannabis legislation making the US map more green.

A large medical state that is attempting to have a ballot initiative (vote) to legalize in the 2024 election cycle is Florida. As we have written extensively, despite being a medical only state it is the 3rd largest cannabis state in the US approaching $2 billion in annual sales. Each state has a different set of rules on how to bring about legislative change and in the case of FL, this involves securing at least 900,000 signatures to secure a spot on the November 2024 ballot.
Supporters have tried in previous years. However, these attempts were blocked by the state Supreme Court for various technical legal reasons. This time we have a heavy weight fight with Trulieve Cannabis (TRUL) supporting the Florida Safe & Smart initiative to the tune of $20 million to ensure proper signature collection. TRUL CEO Kim Rivers recently reported that the initiative has collected 690,000 signatures to date which is more than double what is required to trigger a Supreme Court review of language for the ballot and on the way to securing the necessary 900,000 signatures to secure a spot on the 2024 ballot. Once it gets to the ballot, FL law requires 60% voter approval on election night. Current polls suggest voter support is over 70%. This is a major opportunity to a significant recreational market. Also important from a national debate on federal cannabis legislation is that Florida is a Red state, controlled by Republicans. The more Republican states that transition to recreational adds further pressure to the national discussion for legislative change. Core fund holdings that are among the leaders in FL include TRUL which has 119 dispensaries in FL, GTI and VRNO.
West Coast State Weakness
As mentioned above and in previous commentaries, not all state markets are created equal. From the outset, we have stated that limited license states with reasonable taxation strategies offer a more sustainable business model that also serves to eliminate the illicit market. Most limited license states are east of the Mississippi River. Several large state markets, the incumbent states that embraced legalization early on include OR, WA and CA. The California market is the largest cannabis market in the world, exceeding even the sales of the Canadian cannabis market. Unfortunately, a combination of unlimited licensing, poor control of the illicit market and excessive taxation policies have made it very challenging to do business successfully. A recent recognition of the challenges faced by licensed operators was seen during the month when Curaleaf (CURA) announced the closing of the majority of its operations in CA, CO, and OR, while consolidating operations in MA. This is a substantial pivot from the series of acquisitions over the past 3 years to build a meaningful presence in the country's most mature markets. As a large US MSO, its operational issues have caused headwinds for the sector. It does support our long-held thesis that the west coast states are a challenging series of markets, and an asset light approach is most desired. In the case of CURA, this was a roll up strategy that did not go as planned, as management overbought in unlimited license markets.
Canadian Cannabis
Canopy Growth (WEED) released its fiscal Q3-22 financial statements that were well below analysts’ estimates. This is a continuing story over several years now and serves to exemplify the over building that took place in the Canadian cannabis industry over the last 5 yrs. WEED reported Q3-22 financial results that saw weaker revenues, lower margins moving further away from its stated goal to be cash flow positive in the foreseeable future. Revenues were $101.2M, a QoQ decline of 14.2% below consensus of $116.9M. Both cannabis and non-cannabis produced weakened results with Canadian adult-use sales dropping~14.7% QoQ while its non-cannabis business had a sequential decrease of 11.3%.
Putting an exclamation point on it is that despite previous cost cutting measures, WEED still ended the quarter with a significant cash flow burn of $140 million, with ~$800M of cash and over $1.2 billion of debt. As part of its Q3 release, the company announced significant changes to its production, closing its Smith Falls and Mirabel facilities, with layoffs anticipated of 60% of its workforce. The pain is not over for WEED or the Canadian industry, as previous over building of cultivation combined with an over saturation of retail dispensaries leads to price compression and overall cash flow weakness. But Canopy’s move towards an asset light model indicates that the necessary changes are at least underway.
We highlight weak Canadian cannabis performance here not because we are positive on the Canadian cannabis market but because we want investors to understand the difference between investing in the Canadian industry vs the US cannabis space.
Canadian Retail Saturation Continues
We continue to see moderate national sales volume with a QoQ reduction in sales of -1%. That is concerning because Q3-22 suffered from challenges in provincial distribution with a strike in BC and a security hacker breaking into the OCS system in Ontario disrupting operations. The year over year sales result is up 11% however per capita consumption yet still lag US state markets. Canadian per capita recreational sales data suggests $115 vs various state markets where per capita consumption is greater (California @ $130; Michigan @ $150; Arizona at $200; Colorado at $320).
Data from HiFyre illustrates Q4-22 sales across Canada of $1.17 billion, with the two leading provincial markets being Ontario with quarterly sales of $457 million, and Alberta at $210 million. When we look at the leading LP’s and market share, we see that it is very challenging to sustain leading market share across Canada. The top 5 LPs in terms of sales are Tilray at 7.9% in Q4-22 however YoY dropping from 10.5% in Q4-21; Village Farms at 7.6% moving up from 6.2% in 21, Organigram remaining flat at 6.6% (vs 6.7% in ‘21), Decibel Cannabis a big winner doubling its share at 6.0% vs 3.2% in ‘21; Hexo at 5.9% losing almost half its market share at 9.3% in Q4-21.
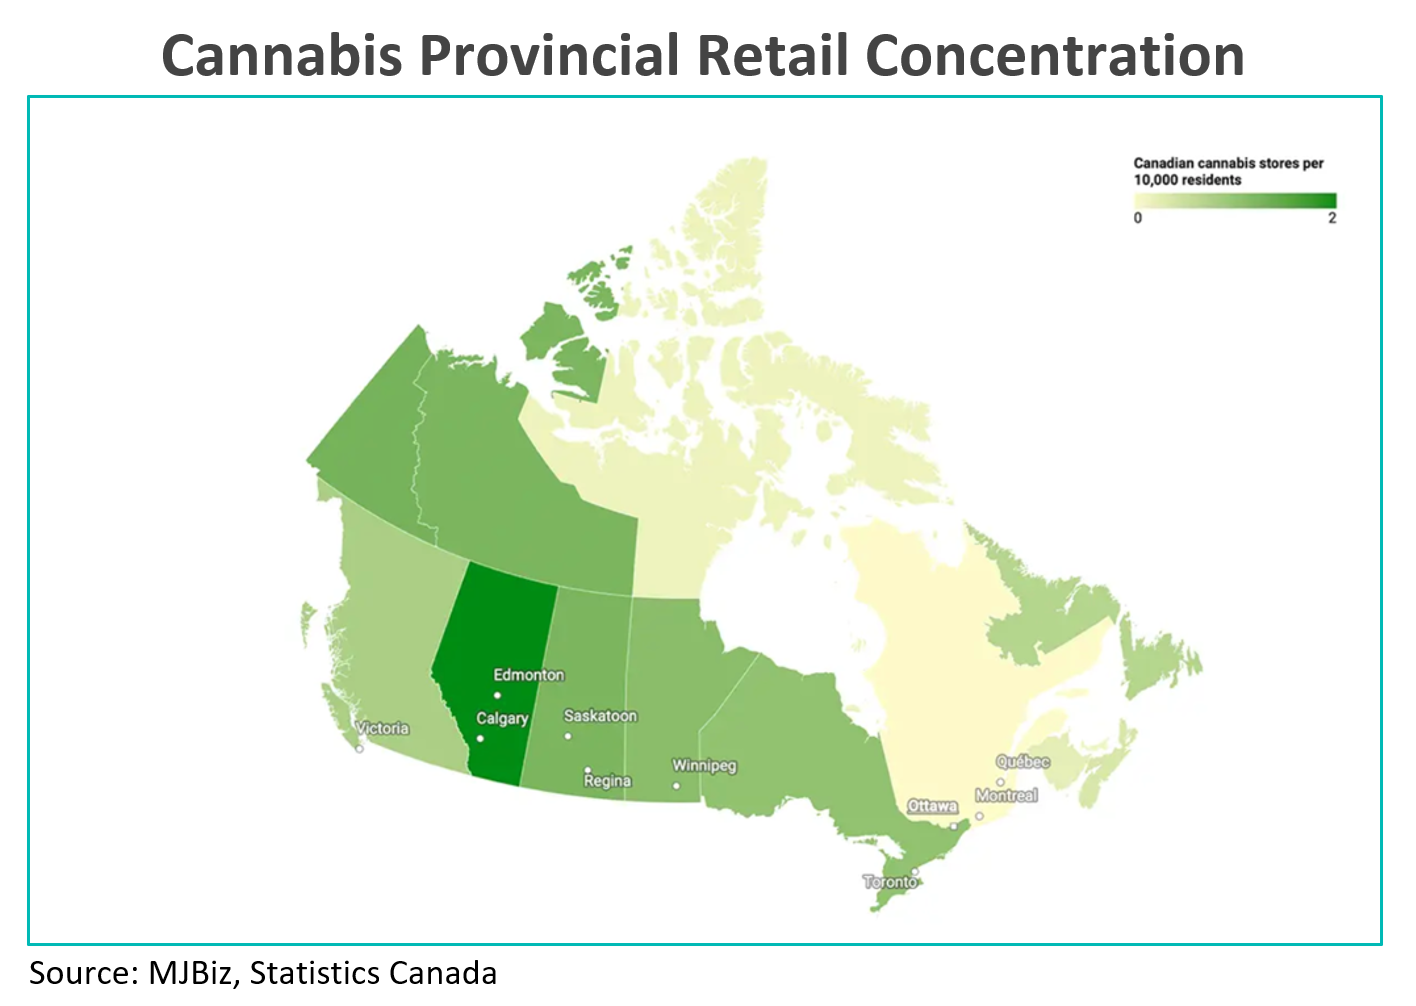
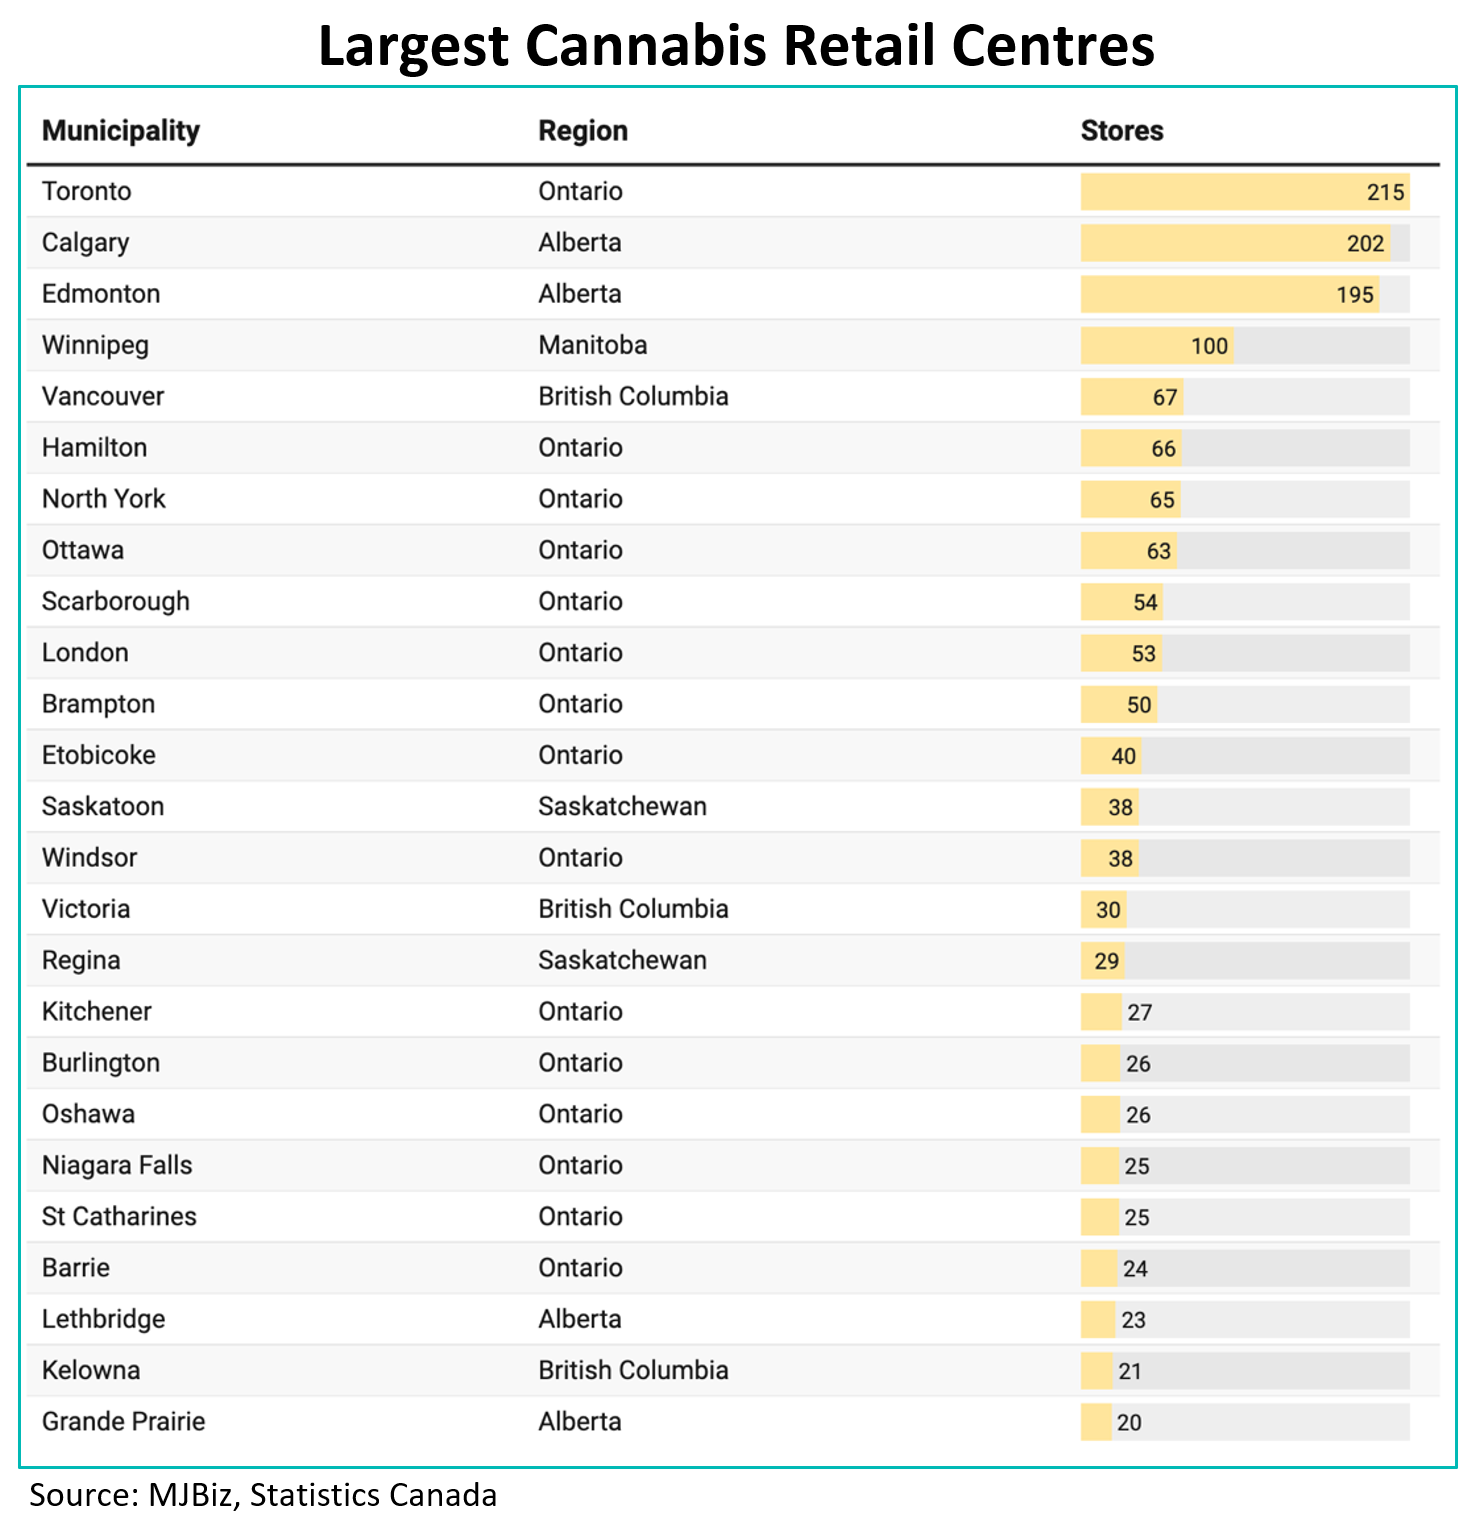
As at the end of January, there were almost 3,700 legal recreational cannabis dispensaries in Canada, or approximately than one store per 10,000 residents at the national level. From a regional perspective, retailers have continued to open stores in Toronto, now home to 215 legal marijuana stores, with Calgary at 202 stores and Edmonton with 195.

The eagerness to open stores in large cities has led to a glut of retail outlets causing retailers to undercut competitors in an attempt to bring in customers however creating an unsustainable situation where retail margins continue to weaken. It is at this retail level that we see the potential for significant consolidation as the cannabis market is over located and must rationalize in order to reach an equilibrium that will meet the demands of consumers and investors. It is for these reasons we continue to be underweight the Canadian cannabis market.
Largest Cannabis Retail Centers.
Healthcare Q4-22 Results
We continue to believe that with the current backdrop of economic data, healthcare and pharma related equities stand out as great value with solid upside in 2023. We provide Q4 results and 2023 guidance notes for the Funds’ top healthcare names.
Johnson & Johnson (JNJ) announced Q4-22 operational sales growth of 4.6%, to $23.7 billion with adjusted earnings per share (EPS) of $2.35, with EPS increasing by 10.3%. The EPS beat consensus of $2.23 EPS in Q4 which given the number of companies whose Q4 results missed analyst estimates we suggest is very supportive for our positioning. For the full year, revenues reached $97.4 billion vs $97.8 billion consensus, a slight miss on top line however the company had operational sales growth of 6.1% with full-year EPS increasing 9.2%. Global pharma results were led by DARZALEX (treatment of blood cancer), STELARA (patients with psoriatic arthritis, and adult patients with moderate to severe Crohn's Disease), ERLEADA (treatment of prostate cancer). On the medtech side, although China was slower due to lockdowns in the fall, global operational growth was over 6% driven by diagnostics around abnormal heartbeat or arrhythmia, contact lens demand and wound closure products.
On the consumer side Q4 did well with strong demand in cough, cold and flu OTC products (Tylenol, Motrin) and the skin and beauty division also did well as back to work and further re openings assisted personal care product demand.
An important component of the Q4 release was the 2023 guidance reflecting the strength and stability of JNJ's business segments, despite macroeconomic challenges. Forecast revenues is $96.9 billion vs $97.9 billion with adjusted EPS of $10.45 to $10.65 a share above analysts’ average estimate of $10.35 a share.
United Health Group (UNH) announced full year revenues of $324.2 billion, 13% growth for the year, led by its Optum and UnitedHealthcare divisions. Optum is primarily a pharmacy benefit manager and while the UnitedHealthcare division offers a variety of health insurance-related products and services to both individuals and employers. Q4 revenue was $82.8 billion representing growth of 12.3% Y/Y, beating consensus by $270 million. Full year net earnings per share was $21.18 while Q4 EPS rose 18.08% to $5.03.
Optum Health revenue per consumer increased 29% in 2022, due to growth in patients served under value-based arrangements and expansion of care delivery and in-home services. Optum Rx revenue grew 9% in 2022 showing growth in its pharmacy care services, including specialty and community-based pharmacies. Supporting our healthcare positioning is UNH guidance for 2023 is positive with forecast revenues of $360 billion with net earnings of $23.65, up 10% on this year’s EPS.
Abbott Labs (ABT) released stable Q4 results with Q4 revenues of $10.1 billion and full year revenues totalling $43.7 billion. Q4 revenues witnessed a gradual decrease in COVID testing related sales which came off 12% in the quarter. However, for the year organic growth was 6.4% U.S. infant formula sales for the year increased 17.4% and its FreeStyle Libre continuous glucose monitoring system continues to be a leader in diabetes treatment with ABT CEO Robert Ford stating that “FreeStyle Libre (and the company’s growing diabetes strategy) will be a $10 billion product in the next five years, implying roughly a 15% annual growth rate.” ABT continues to provide innovative solutions and In December announced U.S. Food and Drug Administration (FDA) approval of its Eterna™ spinal cord stimulation system — the smallest implantable, rechargeable system currently available for the treatment of chronic pain. We continue to see industry leading med tech innovation from ABT that combined to its stable 2023 guidance leads us to continue to be a holder.
Options Strategy
Since inception of the option writing program in September 2018, the Fund has generated significant income from options premium of approximately $4.64 million. We will continue to utilize our options program to look for attractive opportunities given the above average volatility in the sector as we strongly believe that option writing can continue to add incremental value going forward.
Our current interpretation of cross asset volatility indicators and daily trading volume metrics indicate to us, for the time being, we will be selective traders of our preferred option trades, especially on decelerating volume and deteriorating fundamentals. We need to see lower levels of trending volatility and accelerating volume signaling to us a healthier investing environment. Volatility spikes are trending and as such we have been quite selective on our trades, tilted more towards large cap, lower beta health care to execute on, for now. During the month we used our options strategy to assist in rebalancing the portfolio in favor of names we prefer while generating approximately $48,000 in options income. We continue to write covered calls on names we feel are range bound near term and from which we could receive above average premiums which included Eli Lilly and Co (LLY), Tilray Brands Inc. (TLRY), and UnitedHealth Group Inc. (UNH). We also continue to write cash secured puts out of the money at strike prices that offered opportunities to increase our exposure, at more attractive prices, to names already in the Fund including Tilray Brands Inc. (TLRY), Cronos Group Inc. (CRON), SunOpta Inc. (STKL), Merck & Co Inc. (MRK), and Bristol-Myers Squibb Co (BMY)
The Ninepoint Alternative Health Fund, launched in March of 2017 is Canada’s first actively managed mutual fund with a focus on the cannabis sector and remains open to new investors, available for purchase daily.
Charles Taerk & Douglas Waterson
The Portfolio Team
Faircourt Asset Management
Sub-Advisor to the Ninepoint Alternative Health Fund
Ninepoint Alternative Health Fund - Compounded Returns¹ as of January 31, 2023 (Series F NPP5421) | Inception Date - August 8, 2017
| MTD | YTD | 3MTH | 6MTH | 1YR | 3YR | 5YR | INCEPTION (ANNUALIZED) |
|
|---|---|---|---|---|---|---|---|---|
| FUND | -3.6% | -3.6% | -16.4% | -13.4% | -30.5% | -7.1% | -3.1% | 5.3% |
| TR CAN/US HEALTH CARE BLENDED INDEX | -3.6% | -3.6% | -16.4% | -13.4% | -30.5% | -7.1% | -3.1% | -6.9% |
Statistical Analysis
| FUND | TR CAN/US HEALTH CARE BLENDED INDEX | |
|---|---|---|
| Cumulative Returns | 32.6% | -32.5% |
| Standard Deviation | 28.4% | 30.2% |
| Sharpe Ratio | 0.1 | -0.3 |
1 All returns and fund details are a) based on Series F units; b) net of fees; c) annualized if period is greater than one year; d) as at January 31, 2023. The index is 70% Thomson Reuters Canada Health Care Total Return Index and 30% Thomson Reuters United States Healthcare Total Return Index and is computed by Ninepoint Partners LP based on publicly available index information.
The Fund is generally exposed to the following risks. See the prospectus of the Fund for a description of these risks: Cannabis sector risk; Concentration risk; Currency risk; Cybersecurity risk; Derivatives risk; Exchange traded fund risk; Foreign investment risk; Inflation risk; Market risk; Regulatory risk; Securities lending, repurchase and reverse repurchase transactions risk; Series risk; Specific issuer risk; Sub-adviser risk; Tax risk.
Ninepoint Partners LP is the investment manager to the Ninepoint Funds (collectively, the “Funds”). Commissions, trailing commissions, management fees, performance fees (if any), and other expenses all may be associated with investing in the Funds. Please read the prospectus carefully before investing. The indicated rate of return for series F shares of the Fund for the period ended January 31, 2023 is based on the historical annual compounded total return including changes in share value and reinvestment of all distributions and does not take into account sales, redemption, distribution or optional charges or income taxes payable by any unitholder that would have reduced returns. Mutual funds are not guaranteed, their values change frequently and past performance may not be repeated. The information contained herein does not constitute an offer or solicitation by anyone in the United States or in any other jurisdiction in which such an offer or solicitation is not authorized or to any person to whom it is unlawful to make such an offer or solicitation. Prospective investors who are not resident in Canada should contact their financial advisor to determine whether securities of the Fund may be lawfully sold in their jurisdiction.
The opinions, estimates and projections (“information”) contained within this report are solely those of Ninepoint Partners LP and are subject to change without notice. Ninepoint Partners makes every effort to ensure that the information has been derived from sources believed to be reliable and accurate. However, Ninepoint Partners assumes no responsibility for any losses or damages, whether direct or indirect, which arise out of the use of this information. Ninepoint Partners is not under any obligation to update or keep current the information contained herein. The information should not be regarded by recipients as a substitute for the exercise of their own judgment. Please contact your own personal advisor on your particular circumstances. Views expressed regarding a particular company, security, industry or market sector should not be considered an indication of trading intent of any investment funds managed by Ninepoint Partners. Any reference to a particular company is for illustrative purposes only and should not to be considered as investment advice or a recommendation to buy or sell nor should it be considered as an indication of how the portfolio of any investment fund managed by Ninepoint Partners is or will be invested. Ninepoint Partners LP and/or its affiliates may collectively beneficially own/control 1% or more of any class of the equity securities of the issuers mentioned in this report. Ninepoint Partners LP and/or its affiliates may hold short position in any class of the equity securities of the issuers mentioned in this report. During the preceding 12 months, Ninepoint Partners LP and/or its affiliates may have received remuneration other than normal course investment advisory or trade execution services from the issuers mentioned in this report.
Ninepoint Partners LP: Toll Free: 1.866.299.9906. DEALER SERVICES: CIBC Mellon GSSC Record Keeping Services: Toll Free: 1.877.358.0540
Related Funds
Historical Commentary
- Alternative Health Fund 12/2023
- Alternative Health Fund 11/2023
- Alternative Health Fund 10/2023
- Alternative Health Fund 09/2023
- Alternative Health Fund 08/2023
- Alternative Health Fund 07/2023
- Alternative Health Fund 06/2023
- Alternative Health Fund 05/2023
- Alternative Health Fund 04/2023
- Alternative Health Fund 03/2023
- Alternative Health Fund 02/2023


