Ninepoint Focused Global Dividend Fund
February 2023 Commentary
Year-to-date to February 28, the Ninepoint Focused Global Dividend Fund generated a total return of 0.22% compared to the S&P Global 1200 Index, which generated a total return of 4.63%. For the month, the Fund generated a total return of -0.85% while the Index generated a total return of -0.86%.
Ninepoint Focused Global Dividend Fund - Compounded Returns¹ As of February 28, 2023 (Series F NPP964) | Inception Date: November 25, 2015
| 1M | YTD | 3M | 6M | 1YR | 3YR | 5YR | Inception | |
| Fund | -0.9% | 0.2% | -3.7% | 3.4% | -1.9% | 7.1% | 5.7% | 6.4% |
| S&P Global 1200 TR (CAD) | -0.9% | 4.6% | 0.2% | 8.4% | 0.2% | 10.7% | 8.5% | 9.5% |
After a horrible year for investors in 2022, the markets rebounded strongly in January, with the worst performing sectors of 2022 leading (Consumer Discretionary, Communication Services and Technology) and the winners of 2022 lagging (Utilities, Health Care and Consumer Staples). However, in February, the markets reversed some of those gains, particularly in the high beta sectors, and the S&P 500 declined 2.44% on a total return basis. We believe that investors need to be particularly careful about being whipsawed during what could be a volatile but rangebound market over the balance of 2023.
Although short-term narratives are less important than the long-term fundamentals from our perspective, we would point to a few reasons for the pullback in February. First, the calendar Q4 2022 earnings that were released through the month were generally not supportive of the monster rally that had occurred in January. According to FactSet, with 99% of the S&P 500 companies reporting actual results, the quarterly earnings season was “subpar” and fewer companies beat expectations than average. Interestingly, though the blended revenue growth rate for Q4 2022 came in at 5.3%, the blended earnings growth rate came in at -4.6%, the first year-over-year decline since Q3 2020. Margin pressures (driven by the rising cost of raw materials, supply chain inefficiencies, increasing labour costs and other factors) were apparent in the quarter. We expect that Q1 2023 will show the greatest year-over-year decline for the cycle, with less negative results in Q2 2023 before a return to growth in Q3 or Q4 2023.
With the quarterly earnings season essentially complete, the negative earnings revision cycle still seems to be stabilizing. Although the 2023 S&P 500 earnings estimates have declined from a high of $255 to $218 today, the revisions have been decelerating since about mid-December. However, the consensus estimate is now slightly lower than at the end of January and implies negative earnings growth on a year-over-year basis from 2022 to 2023. Given weaker expectations and therefore sentiment, the second reason for the broad market’s disappointing performance in February was a reduction in the forward price to earnings multiple. Recall, that the multiple for the S&P 500 compressed from approximately 21x NTM estimates at the beginning of 2022, bottomed at just 15x NTM estimates in October, rebounded to 19x NTM estimates at the end of January before correcting to 17.5x NTM estimates at the end of February (according to Refinitiv). Clearly, investors are still struggling to find the appropriate price to earnings multiple to use but, importantly, 2024 S&P 500 earnings estimates (currently approximately $230) imply modest earnings growth from 2023 (likely the trough year for the cycle).
The final explanation for the broad market weakness in February was the renewed push higher of the expected Fed Funds terminal rate. Despite inflation peaking in June at 9.1% and steadily trending lower ever since, the deceleration was less dramatic in January (released on February 14), falling to 6.4% compared to 6.5% in December. Unfortunately, the January non-farm payrolls data didn’t really help the “inflation-is-cooling narrative”, with 517,000 jobs created and the unemployment rate remaining at 3.4%. This led the market to reprice the terminal rate for the cycle from perhaps two more hikes of 25 bps each to a range of 5.0% to 5.25% to possibly three more hikes of 25 bps each to a range of 5.25% to 5.50% with a small chance of an additional hike by September. We doubt that the Fed will move beyond the range of 5.25% to 5.50% and, although we don’t expect a pivot to easing monetary policy in 2023, we think that a pause would be supportive for equity valuations enough to fuel the start of a new bull market.
We do believe that in an environment of moderating inflation but slowing growth through 2023, the most important drivers of investment performance will likely be valuation, balance sheet strength and the ability to consistently generate cash flow and earnings. Also, a greater component of total returns will likely come from dividend yields, which meshes nicely with our investment philosophy. In keeping with our mandates, we are concentrating our efforts on free cash flow positive, high quality, dividend growth companies and real asset investments given our positive assessment of the risk/reward outlook over the next two to three years.
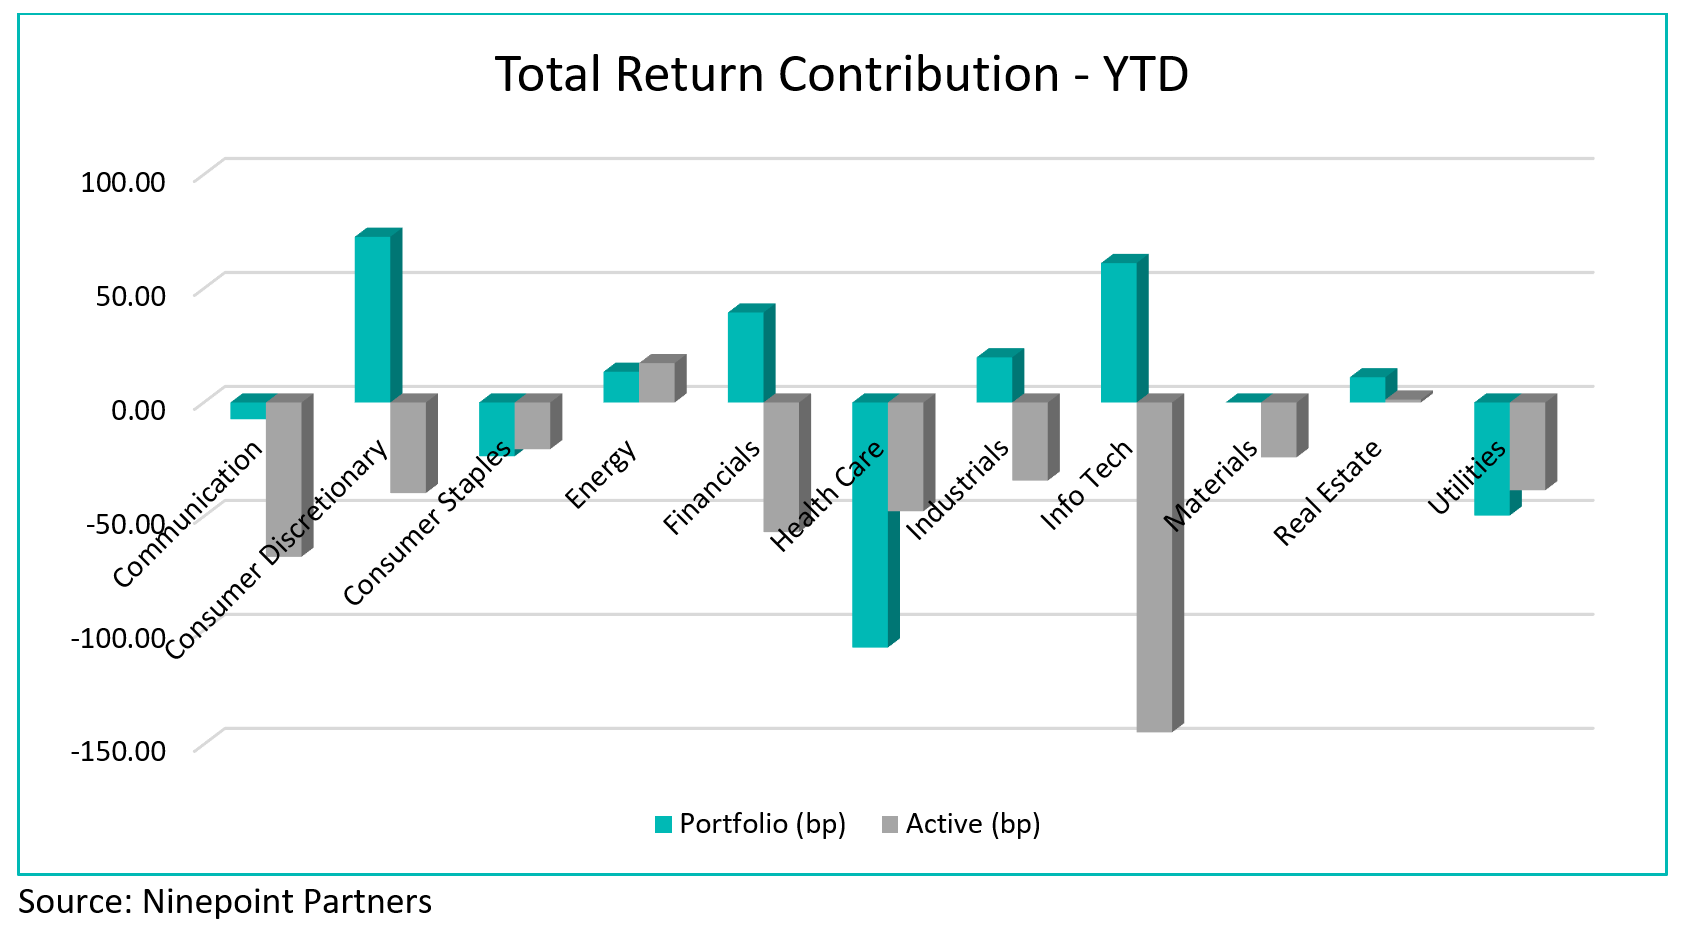
Top contributors to the year-to-date performance of the Ninepoint Focused Global Dividend Fund by sector included Consumer Discretionary (+73 bps), Information Technology (+61 bps) and Financials (+39 bps) while top detractors by sector included Health Care (-107 bps), Utilities (-50 bps) and Consumer Staples (-27 bps) on an absolute basis.
On a relative basis, positive return contributions from the Energy (+17 bps) and the Real Estate (+1 bps) sectors were offset by negative contributions from the Information Technology (-145 bps), Communication (-68 bps) and Financials (-57 bps) sectors.
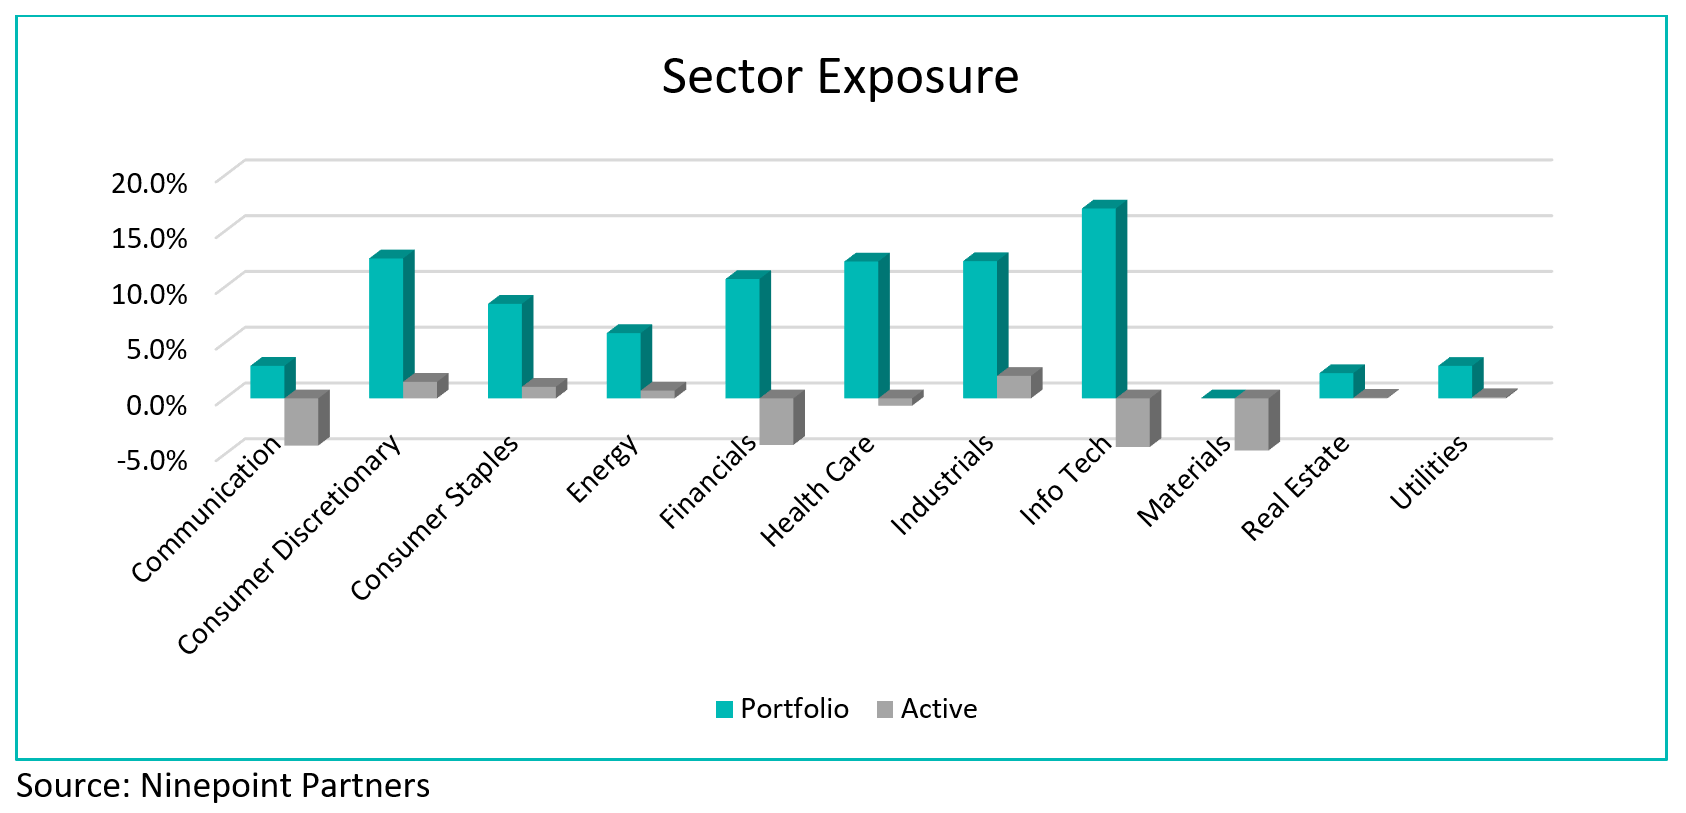
We are currently overweight the Industrials, Consumer Discretionary and Consumer Staples sectors, while underweight the Materials, Information Technology and Communication sectors. With the US Federal Reserve expected to pause interest rate hikes in 2023, we are carefully watching for the negative earnings revision cycle to bottom and unemployment to peak to signal the start of a new equity bull market. We remain focused on high quality, dividend payers that have demonstrated the ability to consistently generate revenue and earnings growth through the cycle.
The Ninepoint Focused Global Dividend Fund was concentrated in 30 positions as at February 28, 2023 with the top 10 holdings accounting for approximately 34.2% of the fund. Over the prior fiscal year, 17 out of our 30 holdings have announced a dividend increase, with an average hike of 8.7% (median hike of 5.7%). We will continue to apply a disciplined investment process, balancing various quality and valuation metrics, in an effort to generate solid risk-adjusted returns.
Jeffery Sayer, CFA
Ninepoint Partners
1 All returns and fund details are a) based on Series F shares; b) net of fees; c) annualized if period is greater than one year; d) as at February 28, 2023; e) 2015 annual returns are from 11/25/15 to 12/31/15. The index is S&P GLOBAL 1200 TR (CAD) and is computed by Ninepoint Partners LP based on publicly available index information.
The Fund is generally exposed to the following risks. See the prospectus of the Fund for a description of these risks: ADR risk; Capital depletion risk; Concentration risk; Credit risk; Currency risk; Cybersecurity risk; Derivatives risk; Exchange traded funds risk; Foreign investment risk; Inflation risk; Interest rate risk; Liquidity risk; Market risk; Rule 144A and other exempted securities risk; Securities lending, Repurchase and reverse repurchase transactions risk; Series risk; Short selling risk; Specific issuer risk; Tax risk.
Ninepoint Partners LP is the investment manager to the Ninepoint Funds (collectively, the “Funds”). Commissions, trailing commissions, management fees, performance fees (if any), and other expenses all may be associated with investing in the Funds. Please read the prospectus carefully before investing. The indicated rate of return for series F shares of the Fund for the period ended February 28, 2023 is based on the historical annual compounded total return including changes in share value and reinvestment of all distributions and does not take into account sales, redemption, distribution or optional charges or income taxes payable by any unitholder that would have reduced returns. Mutual funds are not guaranteed, their values change frequently and past performance may not be repeated. The information contained herein does not constitute an offer or solicitation by anyone in the United States or in any other jurisdiction in which such an offer or solicitation is not authorized or to any person to whom it is unlawful to make such an offer or solicitation. Prospective investors who are not resident in Canada should contact their financial advisor to determine whether securities of the Fund may be lawfully sold in their jurisdiction.
The opinions, estimates and projections (“information”) contained within this report are solely those of Ninepoint Partners LP and are subject to change without notice. Ninepoint Partners makes every effort to ensure that the information has been derived from sources believed to be reliable and accurate. However, Ninepoint Partners assumes no responsibility for any losses or damages, whether direct or indirect, which arise out of the use of this information. Ninepoint Partners is not under any obligation to update or keep current the information contained herein. The information should not be regarded by recipients as a substitute for the exercise of their own judgment. Please contact your own personal advisor on your particular circumstances. Views expressed regarding a particular company, security, industry or market sector should not be considered an indication of trading intent of any investment funds managed by Ninepoint Partners LP. Any reference to a particular company is for illustrative purposes only and should not to be considered as investment advice or a recommendation to buy or sell nor should it be considered as an indication of how the portfolio of any investment fund managed by Ninepoint Partners LP is or will be invested. Ninepoint Partners LP and/ or its affiliates may collectively beneficially own/control 1% or more of any class of the equity securities of the issuers mentioned in this report. Ninepoint Partners LP and/or its affiliates may hold short position in any class of the equity securities of the issuers mentioned in this report. During the preceding 12 months, Ninepoint Partners LP and/or its affiliates may have received remuneration other than normal course investment advisory or trade execution services from the issuers mentioned in this report.
The information provided is general in nature and is provided with the understanding that it may not be relied upon as, nor considered to be, the rendering or tax, legal, accounting or professional advice. Readers should consult with their own accountants and/or lawyers for advice on the specific circumstances before taking any action.
Ninepoint Partners LP: Toll Free: 1.866.299.9906. DEALER SERVICES: CIBC Mellon GSSC Record Keeping Services: Toll Free: 1.877.358.0540

Related Funds
Historical Commentary
- Focused Global Dividend Fund 12/2023
- Focused Global Dividend Fund 11/2023
- Focused Global Dividend Fund 10/2023
- Focused Global Dividend Fund 09/2023
- Focused Global Dividend Fund 08/2023
- Focused Global Dividend Fund 07/2023
- Focused Global Dividend Fund 06/2023
- Jeff Sayer - H1 2023 Market Review and Outlook - Focused Global Dividend Fund
- Focused Global Dividend Fund 05/2023
- Focused Global Dividend Fund 04/2023
- Focused Global Dividend Fund 03/2023
- Focused Global Dividend Fund 01/2023
Toronto, Ontario M5J 2J1 Canada