Ninepoint Global Infrastructure Fund
March 2023 Commentary
Year-to-date to March 31, the Ninepoint Global Infrastructure Fund generated a total return of -0.37% compared to the MSCI World Core Infrastructure Index, which generated a total return of 0.45%. For the month, the Fund generated a total return of 0.95% while the Index generated a total return of 1.67%.
Ninepoint Global Infrastructure Fund - Compounded Returns¹ As of March 31, 2023 (Series F NPP356) | Inception Date: September 1, 2011
| 1M | YTD | 3M | 6M | 1YR | 3YR | 5YR | 10YR | Inception | |
| Fund | 0.9% | -0.4% | -0.4% | 2.2% | -2.3% | 9.2% | 7.3% | 7.0% | 7.2% |
| MSCI World Core Infrastructure NR (CAD) | 1.7% | 0.4% | 0.4% | 7.7% | -2.4% | 8.9% | 7.6% | 10.1% | 11.0% |
It took 475 basis points of hikes from March 2022 to March 2023 (one of the fastest tightening cycles in the past forty years) before the Fed finally broke something in the financial system. The collapse of Silicon Valley Bank, the second largest bank failure in US history, has been well documented. Essentially a classic bank run triggered by a loss of confidence and accelerated by the ease of electronic fund transfers, the situation exposed management’s inability to protect against an asset/liability duration mismatch in a rapidly rising interest rate environment. Note that this is very different than what occurred during the 2008/2009 credit crisis (when the quality of highly leveraged financial assets was called into question) and therefore we don’t foresee widespread contagion or systemic risk. But with more than four thousand regional banks in the US (according to the FDIC), we are concerned about the impact of more stringent regulations and tighter lending standards on future economic growth.
As we get set to start the Q1 2023 earnings season, FactSet Research has provided some interesting information regarding the cadence of the year ahead. In Q1 2023, earnings are expected to decline by 6.8%, the largest dip since Q2 2020 (the depths of the Covid-19 lockdowns) and the second straight quarter of negative earnings growth. Earnings are then expected to decline by 4.6% in Q2 2023, before rebounding by 2.1% in Q3 2023 and 9.0% in Q4 2023. Because revenue growth is expected to be flat to slightly positive in each quarter of 2023, margin pressures (driven by the rising cost of raw materials, supply chain inefficiencies, increasing labour costs and other factors) should be assumed to persist through the first half of 2023. On an annualized basis, S&P 500 estimates for 2023 look to be stabilizing around $220 and for 2024 look to be stabilizing around $235, implying that the current year will likely be the trough of the cycle.
Of course, investors still need to contend with tightening monetary policy and financial conditions (some have estimated that the impact of the banking crisis is equivalent to an incremental 100 bps of rate hikes). Fortunately, inflation looks to have peaked in June 2022 at 9.1%, and has steadily trended lower, dropping to 6.0% in February (released on March 20). But the labour market has remained tight, with total nonfarm payrolls up by 236,00 in March while the unemployment rate remained at 3.5% (although the JOLTS did fall below 10 million in February). The key data points to watch before the next FOMC meeting on May 3 include the CPI, PPI, and retail sales numbers. These upcoming releases will likely determine if the Fed hikes again or finally goes on pause for the cycle.
Currently, market odds have been flip-flopping between hike and no hike scenarios, suggesting that the decision is extremely close. Given the signs of stress in the financial system, we personally doubt that the Fed will move much further and, although we don’t expect a pivot to easing monetary policy in 2023, we think that a pause would be supportive for equities. However, we continue to believe that investors need to be careful about being whipsawed during what could be a volatile but rangebound market over the balance of 2023.
From our perspective, in an environment of moderating inflation but slowing growth through 2023, the most important drivers of investment performance will likely be valuation, balance sheet strength and the ability to consistently generate cash flow and earnings. Also, a greater component of total returns will likely come from dividend yields, which meshes nicely with our investment philosophy. In keeping with our mandates, we are concentrating our efforts on free cash flow positive, high quality, dividend growth companies and real asset investments given our positive assessment of the risk/reward outlook over the next two to three years.
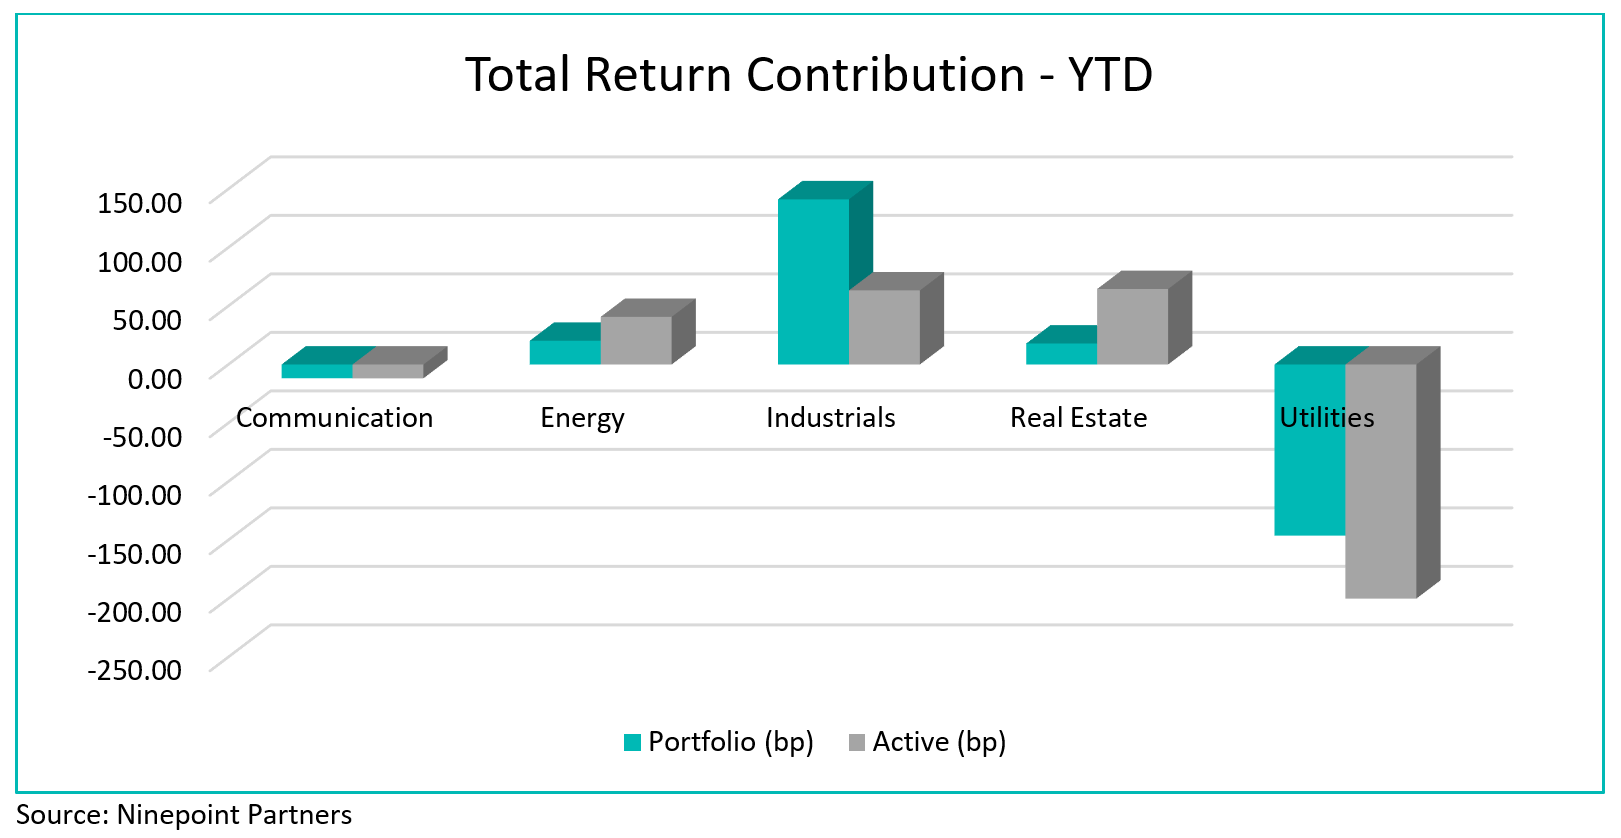
Top contributors to the year-to-date performance of the Ninepoint Global Infrastructure Fund by sector included Industrials (+141 bps), Energy (+20 bps) and Real Estate (+18 bps) while top detractors by sector included Utilities (-146 bps) and Communication (-12 bps) on an absolute basis.
On a relative basis, positive return contributions from the Real Estate (+65 bps), Industrials (+63 bps) and Energy (+41 bps) sectors were offset by negative contributions from the Utilities (-200 bps) and Communication (-12 bps) sectors.
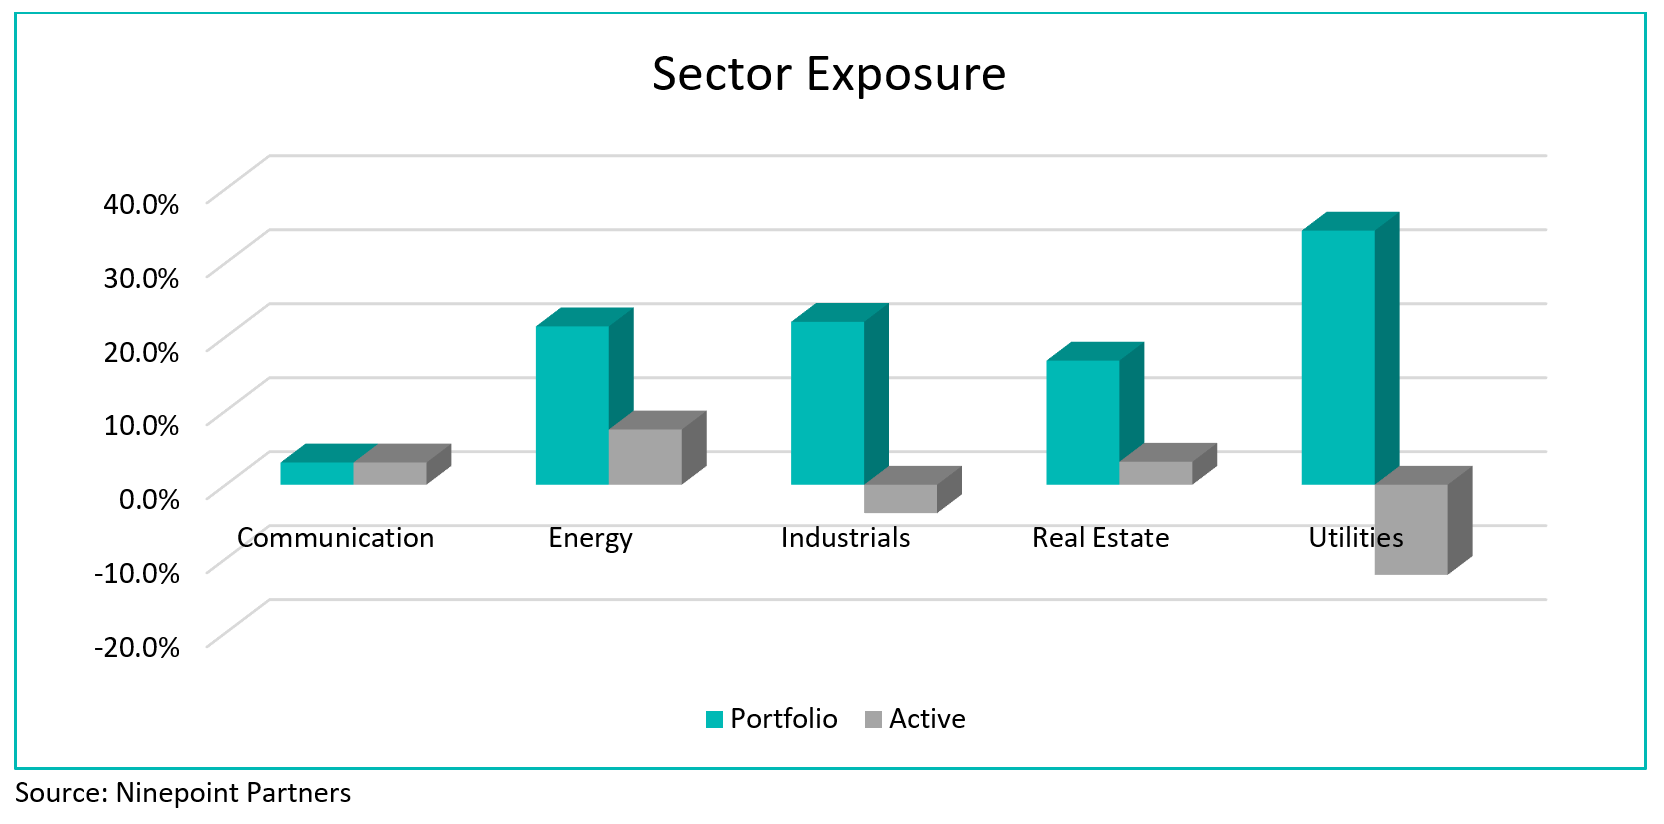
We are currently overweight the Energy, Real Estate and Communication sectors and underweight the Utilities and Industrials sectors. With the US Federal Reserve expected to pause interest rate hikes in 2023, we are carefully watching for perhaps the most highly anticipated downturn ever to play out before the next bull market begins. In the meantime, we remain focused on high quality, dividend payers that have demonstrated the ability to consistently generate revenue and earnings growth through the cycle.
We continue to believe that the clean energy transition will be one of the biggest investment themes for many years ahead and infrastructure stands to be a clear beneficiary. Therefore, we are comfortable having exposure to both traditional energy investments and renewable energy investments given the importance of energy sustainability and security of supply around the world.
The Ninepoint Global Infrastructure Fund was concentrated in 30 positions as at March 31, 2023 with the top 10 holdings accounting for approximately 36.7% of the fund. Over the prior fiscal year, 15 out of our 30 holdings have announced a dividend increase, with an average hike of 11.7% (median hike of 0.6%). Using a total infrastructure approach, we will continue to apply a disciplined investment process, balancing valuation, growth, and yield in an effort to generate solid risk-adjusted returns.
Jeffrey Sayer, CFA
Ninepoint Partners
Refinitiv Lipper Fund Awards, ©2022 Refinitiv. All rights reserved. Used under license.
The fund has been named Refinitiv Lipper Fund Awards Canada 2022 Winner, Best Global Infrastructure Equity Fund, over a three-year period out of a total of 13 funds ending July 31, 2022.
Lipper Award Methodology
The Refinitiv Lipper Fund Awards, granted annually, highlight funds and fund companies that have excelled in delivering consistently strong risk-adjusted performance relative to their peers.
The Refinitiv Lipper Fund Awards are based on the Lipper Leader for Consistent Return rating, which is a risk-adjusted performance measure calculated over 36, 60 and 120 months. The fund with the highest Lipper Leader for Consistent Return (Effective Return) value in each eligible classification wins the Refinitiv Lipper Fund Award. For more information, see lipperfundawards.com Although Refinitiv Lipper makes reasonable efforts to ensure the accuracy and reliability of the data contained herein, the accuracy is not guaranteed by Refinitiv Lipper.
The merit of the winners is based on objective, quantitative criteria. The influential and prestigious Refinitiv Lipper Fund Awards are based on our Lipper Leaders Rating for Consistent Return. Lipper Leaders Ratings are subject to change on a monthly basis. Individual classifications of three, five, and 10-year periods, as well as fund families with high average scored for the three-year period, are also recognized. The awards are based on Refinitiv Lipper’s proven proprietary methodology, which can be viewed here.
1 All returns and fund details are a) based on Series F units; b) net of fees; c) annualized if period is greater than one year; d) as at March 31, 2023; e) 2011 annual returns are from 09/01/11 to 12/31/11. The index is 100% MSCI World Core Infrastructure NR (CAD) and is computed by Ninepoint Partners LP based on publicly available index information.
The Fund is generally exposed to the following risks. See the prospectus of the Fund for a description of these risks: capital depletion risk; concentration risk; credit risk; currency risk; cybersecurity risk; derivatives risk; exchange traded funds risk; foreign investment risk; income trust risk; inflation risk; interest rate risk; liquidity risk; market risk; regulatory risk; securities lending, repurchase and reverse purchase transaction risk; series risk; short selling risk; small company risk; specific issuer risk; tax risk.
Ninepoint Partners LP is the investment manager to the Ninepoint Funds (collectively, the “Funds”). Commissions, trailing commissions, management fees, performance fees (if any), other charges and expenses all may be associated with mutual fund investments. Please read the prospectus carefully before investing. The indicated rate of return for series F units of the Fund for the period ended March 31, 2023 is based on the historical annual compounded total return including changes in unit value and reinvestment of all distributions and does not take into account sales, redemption, distribution or optional charges or income taxes payable by any unitholder that would have reduced returns. Mutual funds are not guaranteed, their values change frequently and past performance may not be repeated. The information contained herein does not constitute an offer or solicitation by anyone in the United States or in any other jurisdiction in which such an offer or solicitation is not authorized or to any person to whom it is unlawful to make such an offer or solicitation. Prospective investors who are not resident in Canada should contact their financial advisor to determine whether securities of the Fund may be lawfully sold in their jurisdiction.
The opinions, estimates and projections (“information”) contained within this report are solely those of Ninepoint Partners LP and are subject to change without notice. Ninepoint Partners makes every effort to ensure that the information has been derived from sources believed to be reliable and accurate. However, Ninepoint Partners assumes no responsibility for any losses or damages, whether direct or indirect, which arise out of the use of this information. Ninepoint Partners is not under any obligation to update or keep current the information contained herein. The information should not be regarded by recipients as a substitute for the exercise of their own judgment. Please contact your own personal advisor on your particular circumstances. Views expressed regarding a particular company, security, industry or market sector should not be considered an indication of trading intent of any investment funds managed by Ninepoint Partners. Any reference to a particular company is for illustrative purposes only and should not to be considered as investment advice or a recommendation to buy or sell nor should it be considered as an indication of how the portfolio of any investment fund managed by Ninepoint Partners is or will be invested. Ninepoint Partners LP and/or its affiliates may collectively beneficially own/control 1% or more of any class of the equity securities of the issuers mentioned in this report. Ninepoint Partners LP and/or its affiliates may hold short position in any class of the equity securities of the issuers mentioned in this report. During the preceding 12 months, Ninepoint Partners LP and/or its affiliates may have received remuneration other than normal course investment advisory or trade execution services from the issuers mentioned in this report.
Ninepoint Partners LP: Toll Free: 1.866.299.9906. DEALER SERVICES: CIBC Mellon GSSC Record Keeping Services: Toll Free: 1.877.358.0540

Awards

Related Funds
Historical Commentary
- Global Infrastructure Fund 12/2023
- Global Infrastructure Fund 11/2023
- Global Infrastructure Fund 10/2023
- Global Infrastructure Fund 09/2023
- Global Infrastructure Fund 08/2023
- Global Infrastructure Fund 07/2023
- Global Infrastructure Fund 06/2023
- Jeff Sayer - H1 2023 Market Review and Outlook - Real Asset Strategies
- Global Infrastructure Fund 05/2023
- Global Infrastructure Fund 04/2023
- Global Infrastructure Fund 02/2023
- Global Infrastructure Fund 01/2023
Toronto, Ontario M5J 2J1 Canada