Ninepoint Gold & Precious Minerals Fund
Q4 2023 Commentary
2023 was a year of Divergences for Precious Metals
Divergence (noun): the situation in which two things become different.
Karl Pearson, a brilliant mathematician born in the 19th century coined the phrase, “correlation does not imply causation”. We as humans, have yet to teach our machines this. Most gold trading is done by algorithms today. The algorithms started selling gold bullion because they were programmed into thinking that rising yields would be negative for the metal. Sadly, humans have also followed their computer overlords into the trade as seen through the lens of ETF flows.
A noteworthy exception to AI group thinking is the human central bankers that are trading in their depreciating USD for physical gold at a record pace. While Westerners have been focused on rising rates, very few have paid attention to the rising debts and even fewer have paid attention to the rising costs associated with servicing the debt. In the US for example, the Federal debt to GDP ratio has reached a staggering 120%. This number does not include unfunded liabilities and other public and private debt. The cost of servicing this debt is a hair under $1T, larger than the entire defence budget of the United States.
Algo traders notwithstanding, the assumed inverse relationship between rising interest rates and gold prices has broken apart. Divergence means two similarities that no longer pertain. Machine traders are still operating in a relationship that is becoming extinct. Human traders haven’t caught on either. That in large part explains the mysterious strength in gold prices that has occurred despite the absence of Western capital flows.
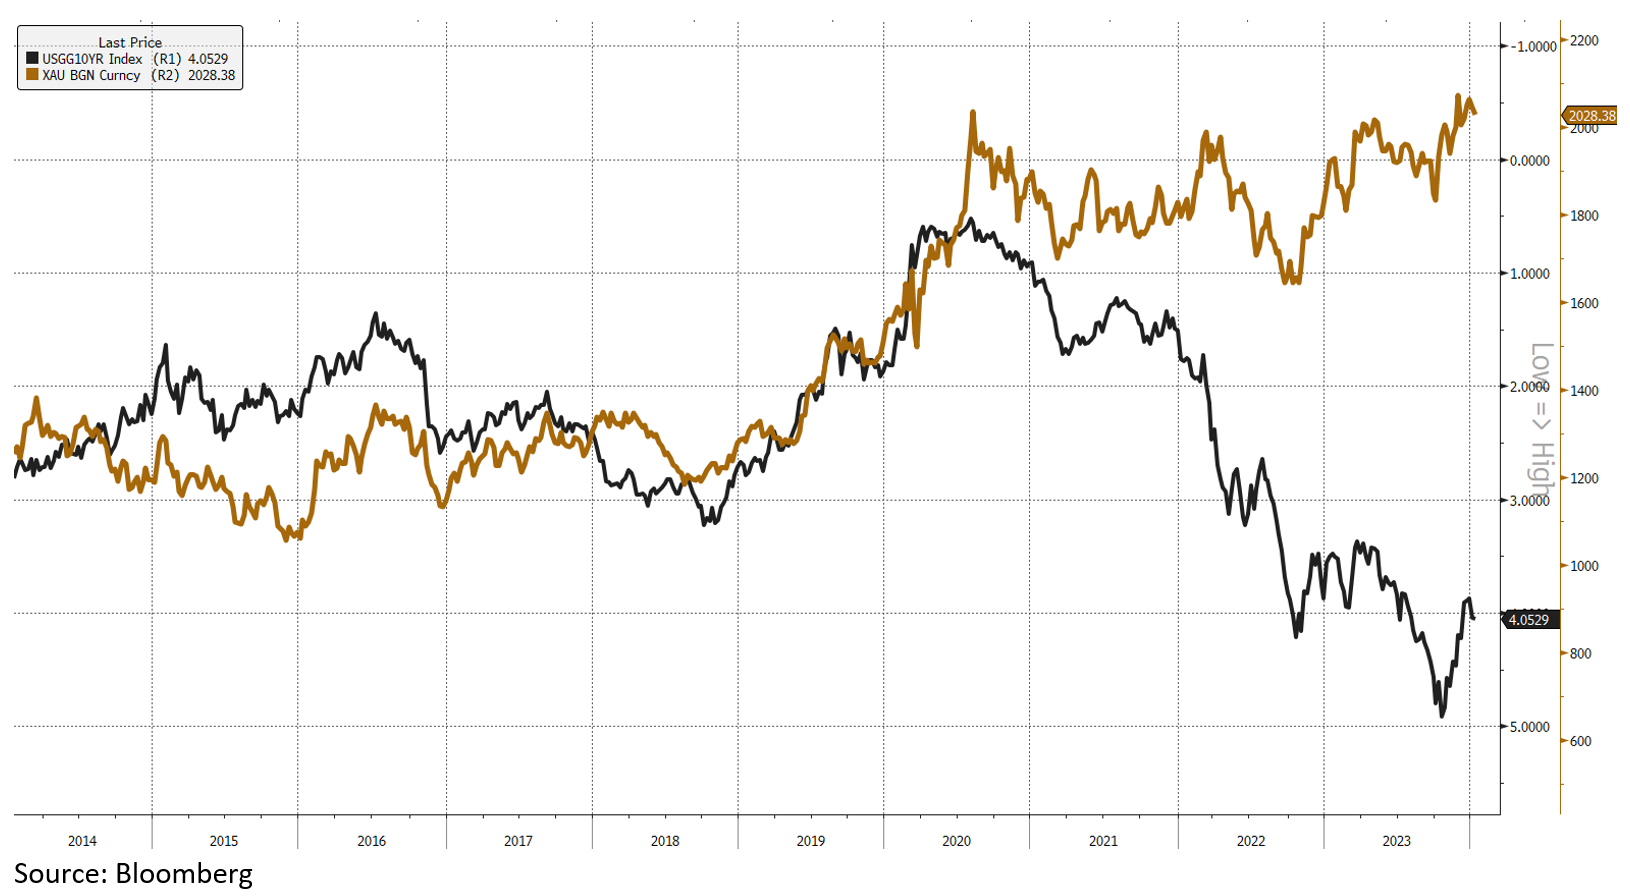
Western investors have typically treated gold almost like a zero coupon bond because gold has typically demonstrated a decent correlation to long duration bonds. The chart below shows the price of gold against an inverted 10-year. Note how higher yields have put pressure on gold prices and vice versa. This is yet another relationship that has diverged of late with gold remaining buoyant despite an enormous surge in yields.
In 2023 investors were net sellers of their GOLD bullion. If money flows dictate the direction of price, then gold strength would appear inexplicable to mainstream pundits. The total number of ounces held by gold bullion ETFs declined 8.7%. Bullion ETFs held 93.8M oz at the beginning of 2023 which declined to 85.6M ounces as 2023 ended. Despite investor dislike for bullion, gold gained 13.1% and new all-time highs were established. The average price of gold through 2023 also registered a new record with the average price rising to $1942/oz versus $1802 in 2022 oz.
As for gold, 2023 was a year of divergence for silver. Silver bullion ETFs held 700M oz of silver as the year ended, down from 750M oz held at the outset of the year. Investors in silver bullion redeemed nearly 6.7% of their holdings for cash. Despite this selling, the price of silver was nearly flat for 2023, declining a mere 0.66%.
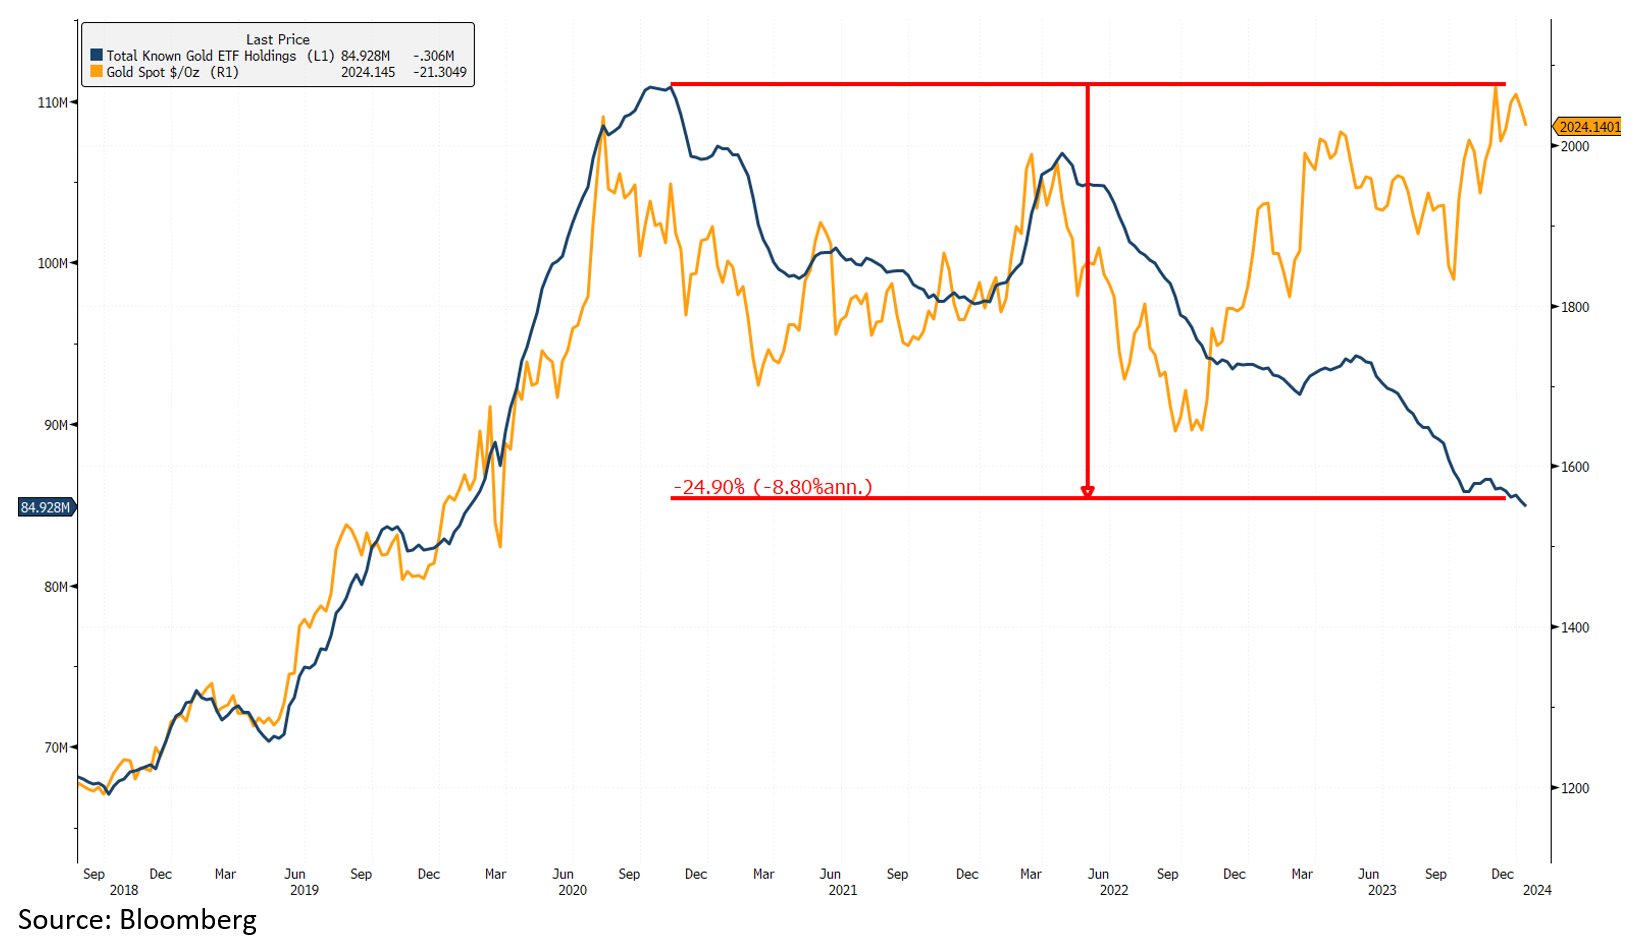
2023 was an important year for gold and silver alike for a simple reason. The relationship between investor capital flows and the price metal broke apart. Consider the chart below that graphs the price of gold (yellow) versus the total ounces held by bullion ETFs. It does not take a trained eye to recognize a correlation between the two. The reason is simple. Investor capital, when positive, was a source of demand for the metal and vice versa.
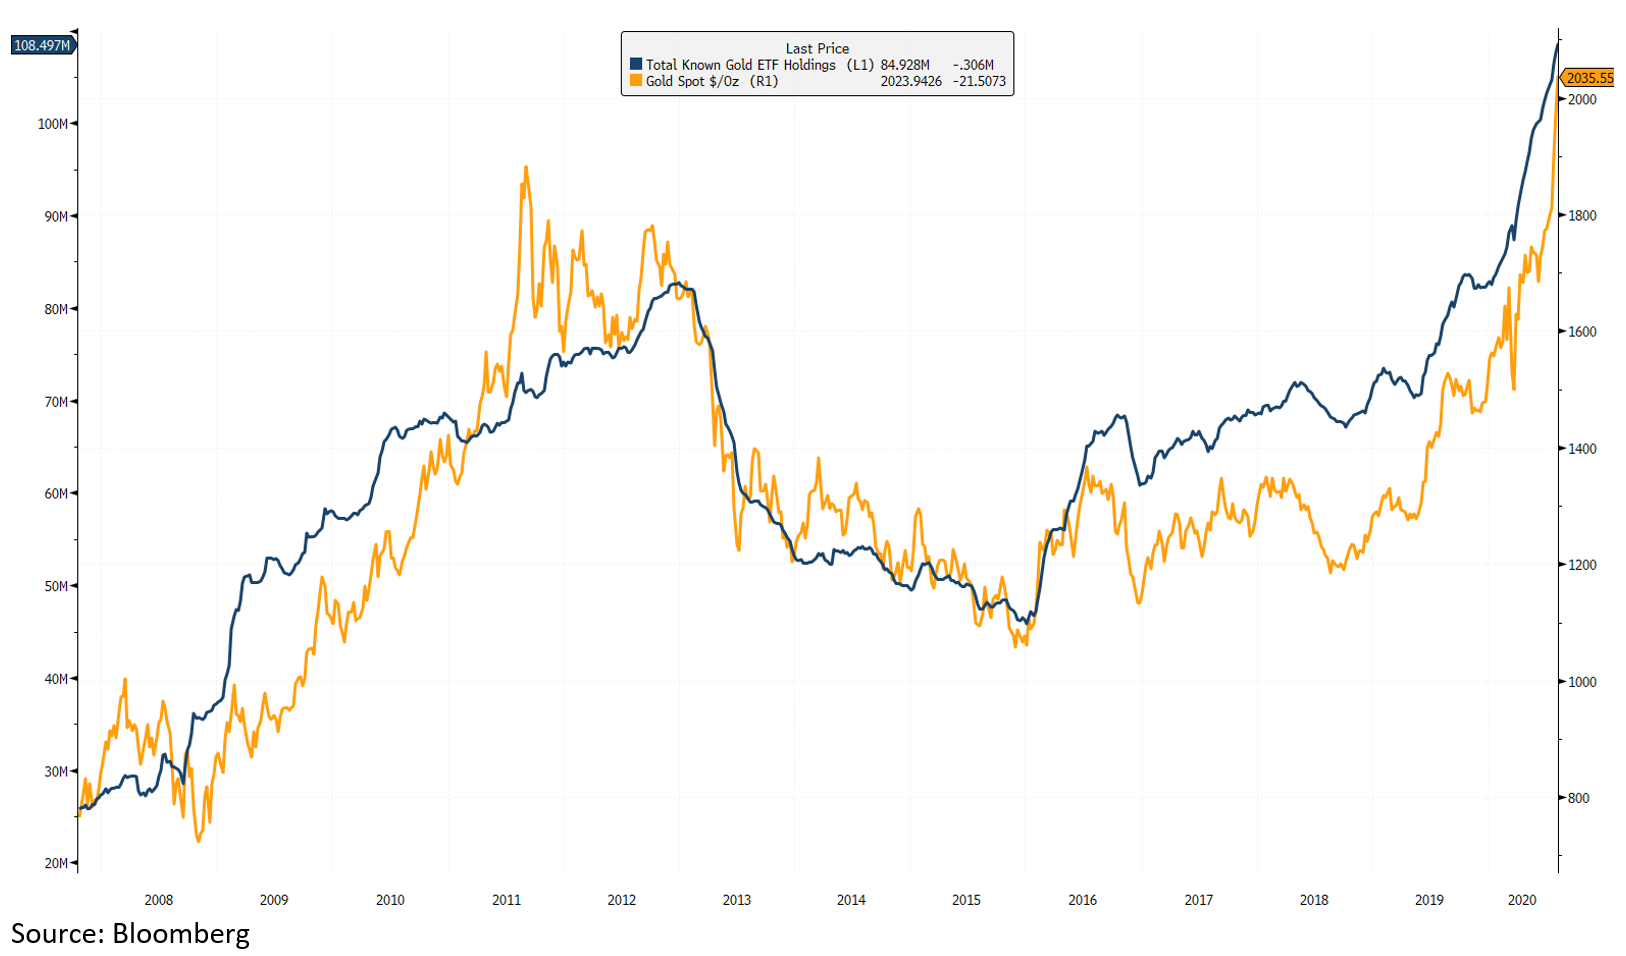
This relationship started coming apart in toward the back end of 2022 and persisted all through 2023. The message here is louder than the image below: there is a new buyer(s) of gold.
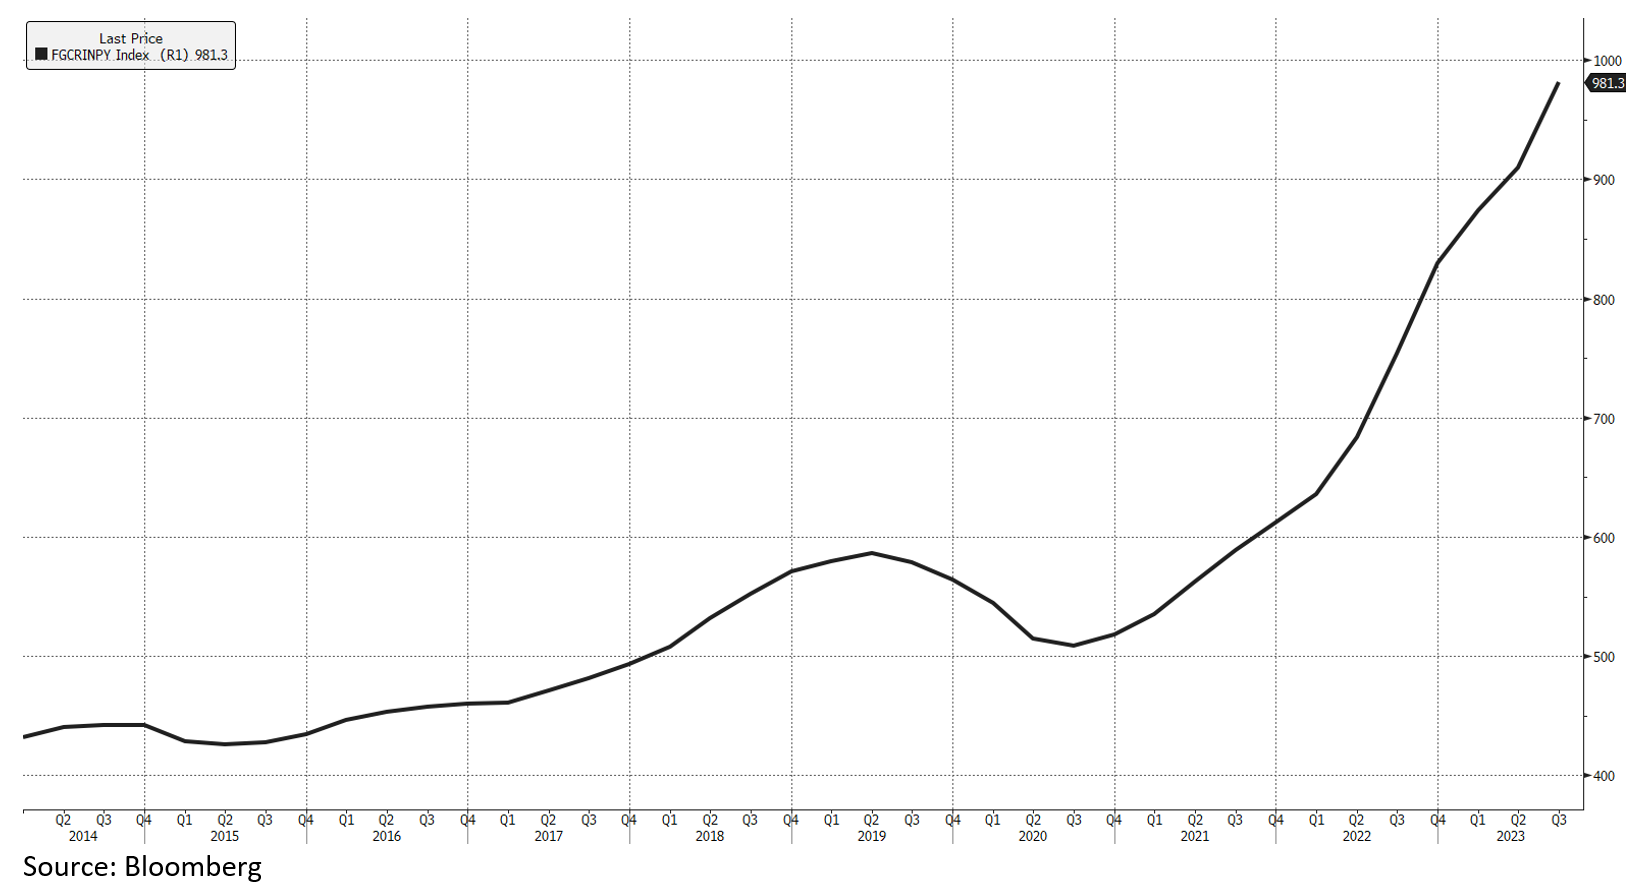
Central banks emerged as large buyers of gold in 2022 as the world and central bankers grappled with the geopolitical impacts of the Russia-Ukraine war. Through 2022, central banks bought 1136 tons of gold, easily absorbing the impact of ETF sales. The 2022 purchases appear to have been a start of a trend as the gold purchases by central banks continued through 2023. While we do not have the final tally for the year, central banks had soaked up almost 800 tons of gold through the first three quarters.
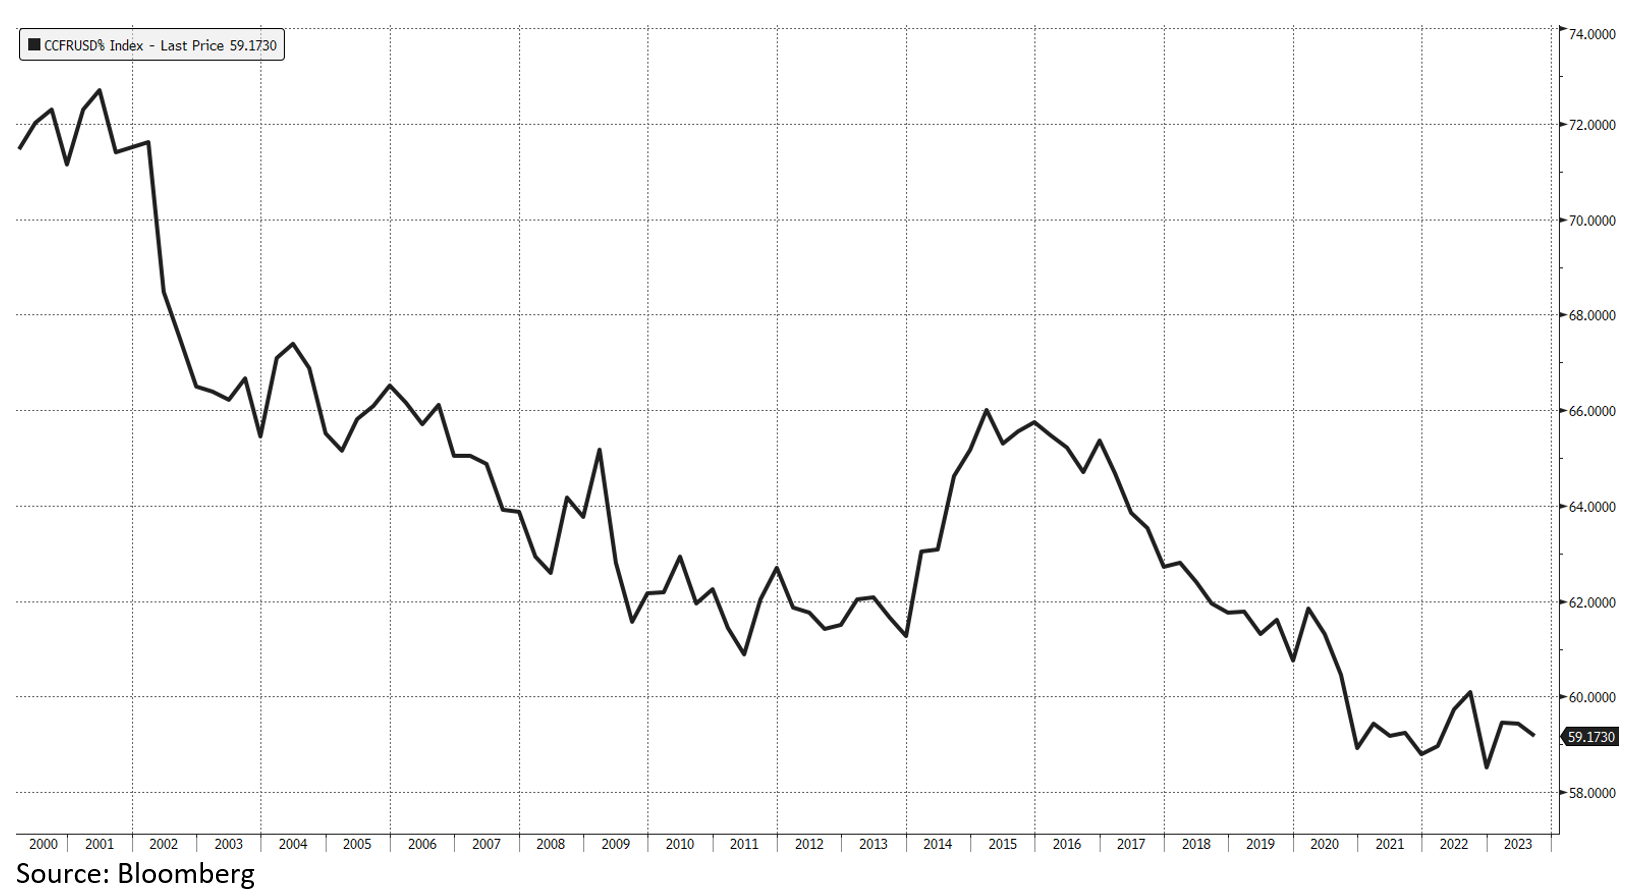
The annual tax receipts collected by the federal government are around $2.8T. Contrast this with the debt servicing costs that are now at $1T, as stated earlier. Simple math shows that over 35% of all taxes are going towards the cost of servicing the debt, while the overall debt continues to only go higher. This is a situation that is not being appreciated by enough market participants – yet. Nonetheless, this development is being viewed with eyes wide open by the central banks around the world which have a choice of holding bullion which has no counterparty risk, or an IOU issued by the US. Since the beginning of this millennium, the percentage of foreign exchange reserves denominated in the almighty US Dollar has continued to dwindle from over 72% in 2000 to under 60% at the time of writing.
As the amount of global reserves allocated to the USD has declined, the amount of gold reserves held by global central banks has risen – yet another divergence. The global US Dollar hegemony has been a product of the 1945 US-Saudi pact linking oil sales to the US Dollar. This led to virtually all oil in international markets being priced in US Dollars. This relationship is being tested of late. A recent WSJ article reported that an estimated 20% of all oil sales in 2023 were conducted without the use of the USD. The overarching takeaway here is this – the global dominance of the US dollar is being eroded and gold is reasserting its importance as a reserve asset.
Will investors who have been selling their gold despite its rising importance on the world stage change their minds? We believe so. It is not inconceivable that in the not too distant future when the focus shifts from yields to debt service costs and spiraling debts, we will see investors wade back into the safety of gold. We could see some fireworks when investors begin competing with the central banks and Asian buyers for the same quantity of gold. We can’t wait for this chapter to begin.
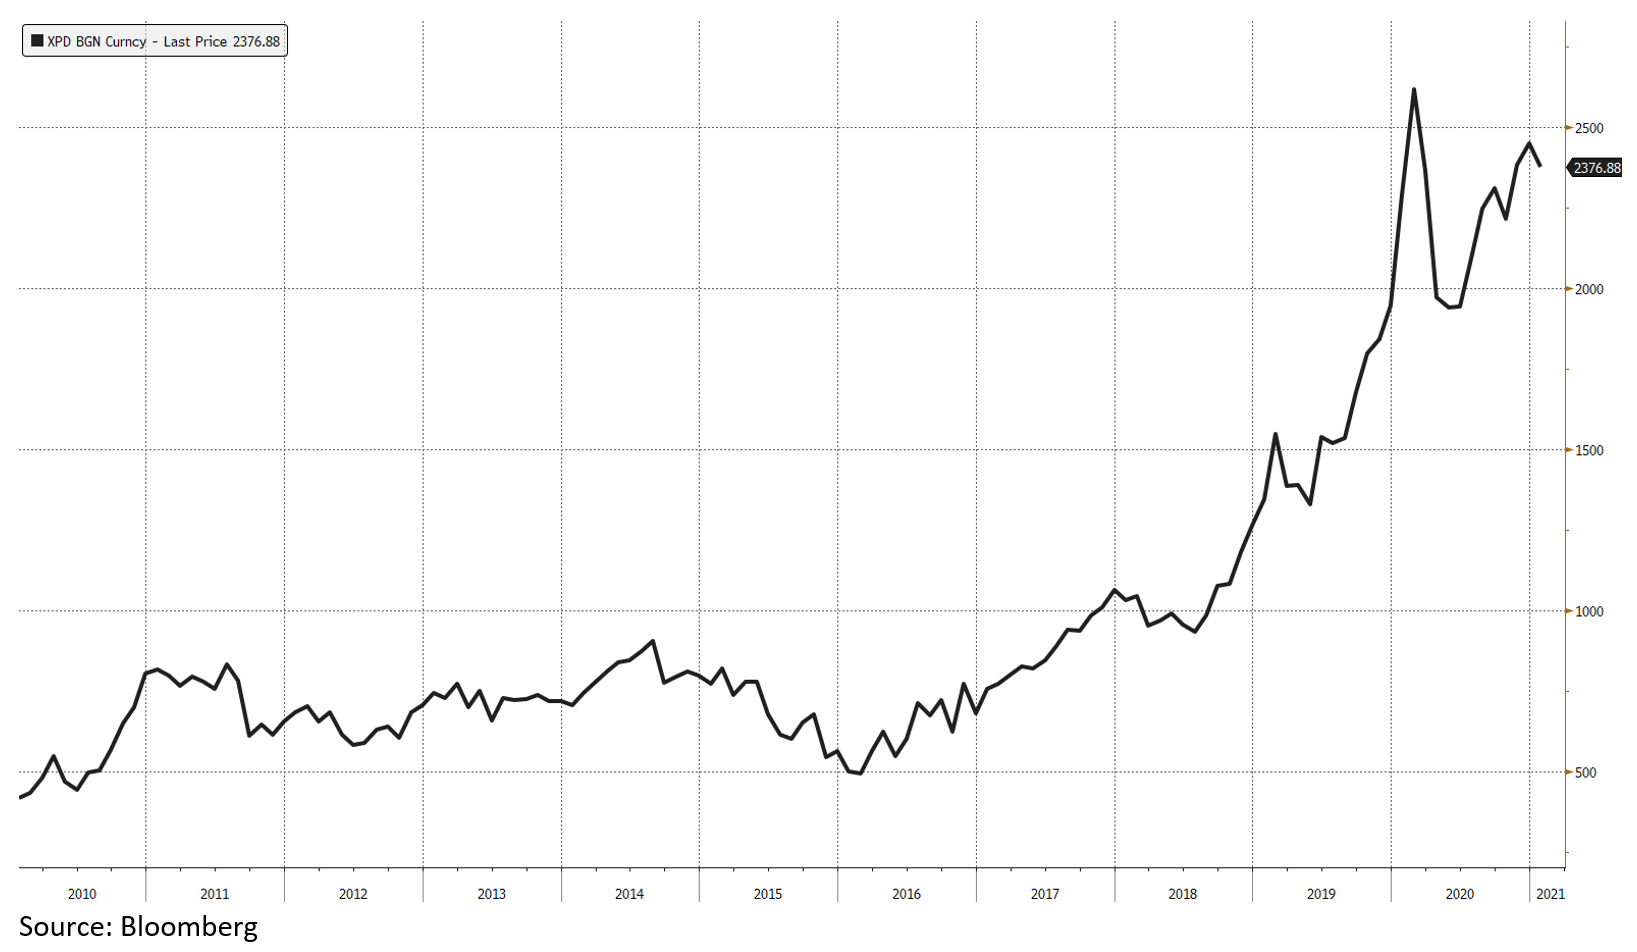
While central banks have not purchased silver for their reserves, silver’s strength in the face of enduring ETF sales in 2023 also deserves a closer look. The current setup in silver has echoes of what transpired in palladium between 2010-2020. The palladium market was undersupplied during this period and left automakers scrambling for the metal. Palladium was essential for the automakers to build catalytic convertors, a mechanism that cleans exhaust fumes. Palladium prices did not immediately react to the undersupplied market at the outset but patient investors were mightily rewarded. Starting from 2016 palladium prices staged a furious rally rising from $500/oz to nearly $3000/oz in 2020.
According to the silver institute, silver has been undersupplied and in a net deficit since 2019. The table below shows the supply demand picture over the better part of the past decade. Note that while the 2023 numbers have yet to be finalized, a large deficit is still expected. As was the case for palladium, despite the persistent deficits, the price of silver has not reacted higher. We suspect that like palladium, the ongoing deficits in silver are creating conditions that could produce a monumental rally as industrial users scramble to get their hands on the metal. On this note, it is worth pointing out two things. Photovoltaics (solar panels) are fast emerging as the largest consumer of physical silver. This sector has enormous support both from governments eager to decarbonize their economy and from consumers eager to reduce their reliance on electric grids. It would not surprise me if the demand for solar panels remains resilient even through weaker economic conditions. The rising demand for silver out of the PV industry is important for another reason. Most industrial applications that utilize silver such as in electronics and for brazing have a lifespan of 10-15 years. Following the end of useful life, these components are recycled and silver is extracted. In the case of PVs, the useful life of solar cells is 40+ years. This essentially means that the silver that is going into the PV sector will be locked out of the recycling chain for a long time to come, further reducing the overall supply available to the market. The only solution here is for more mines containing significant silver to be brought online. With silver below $25/oz this is a difficult proposition.
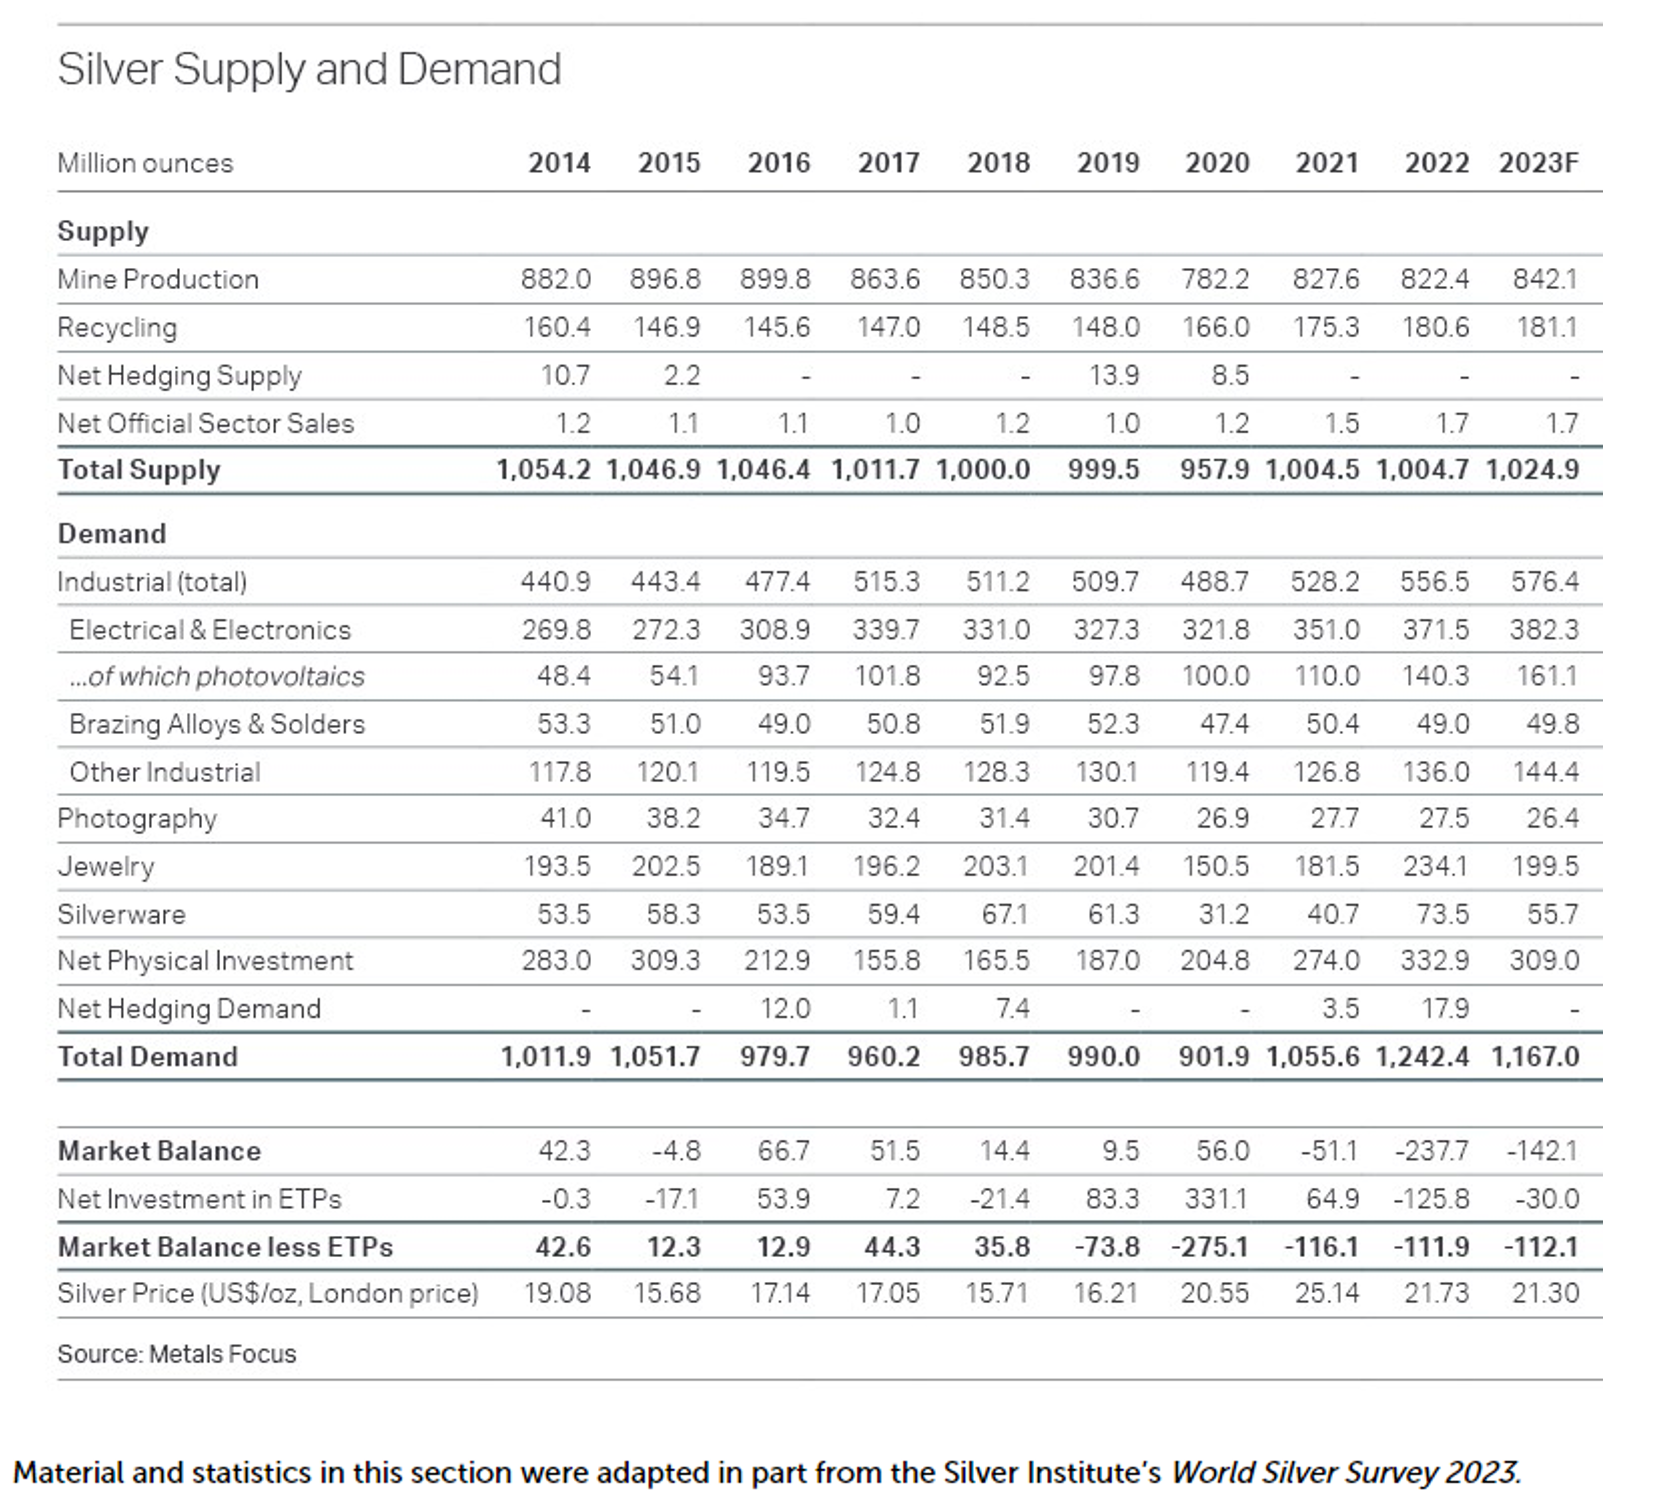
https://www.silverinstitute.org/silver-supply-demand/
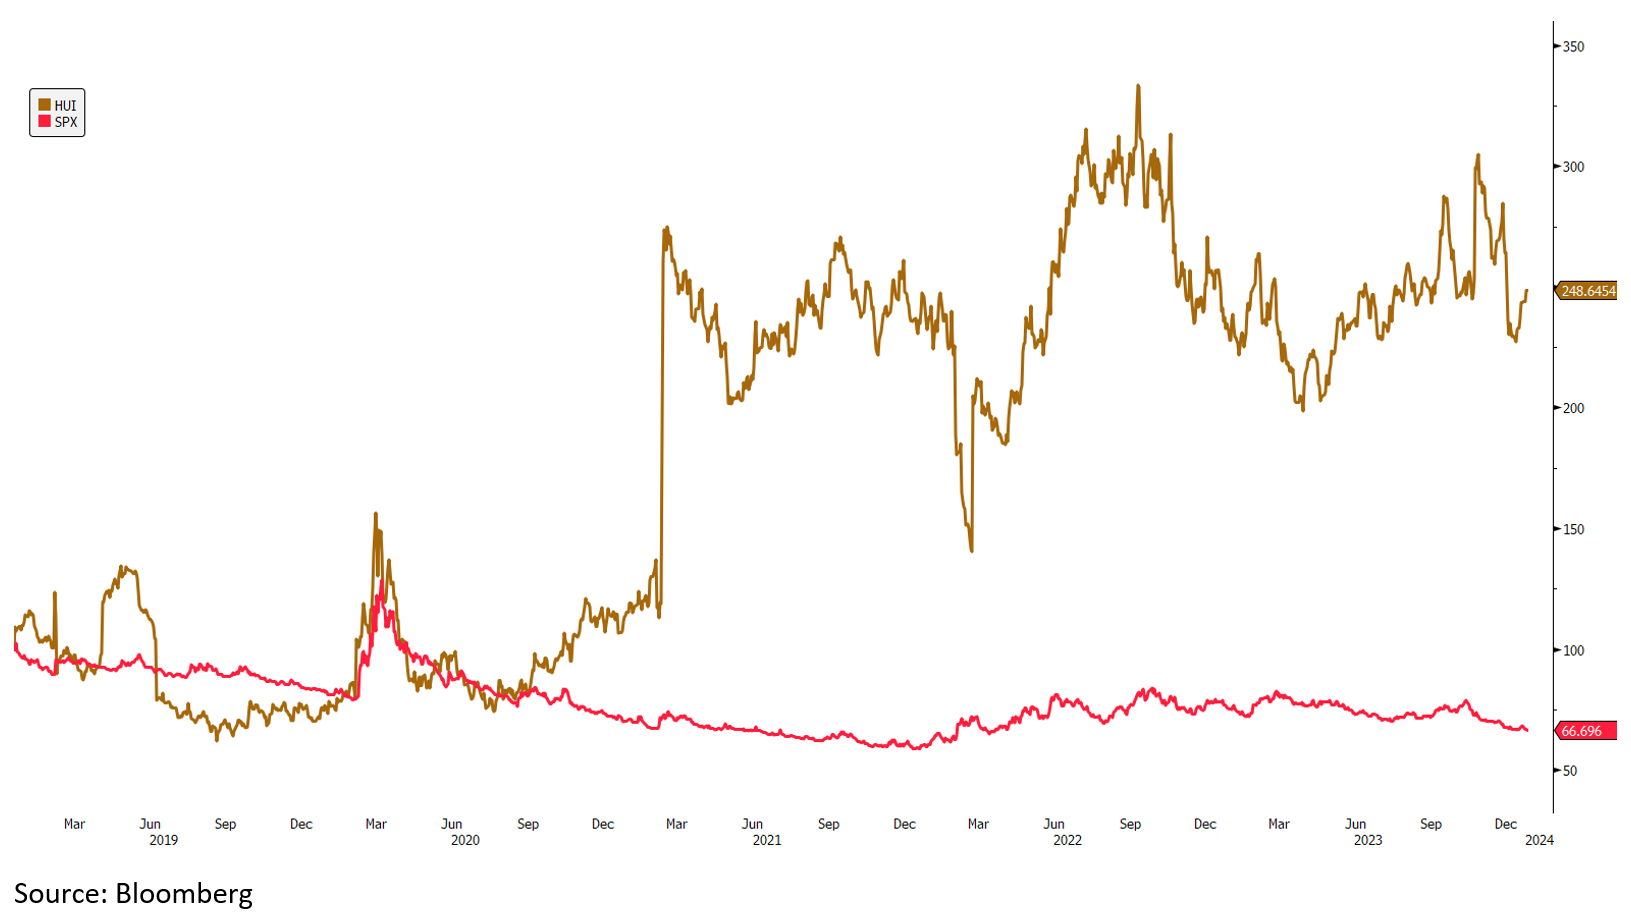
We have seen important divergences in precious metal equities as well. For instance, the dividend yield of the widely followed HUI Index has risen by nearly 250% over the past five years while the dividend yield of the S&P has declined by over 33%. The decline in the S&P yield has to do more with its valuations going up and to the right while the HUI has become cheaper.
Why haven’t precious metal equities performed better with gold prices near all-time highs?
This is a question we get asked often. There are many nuances at play for precious metal equities. However, the biggest theme playing out in the segment has been that of outflows. Investors have been redeeming their holdings in precious metal equities for cash for several years now. The widely followed GDX has fewer units outstanding than it did five years ago. The same can be said about many other precious metal equity offerings out there. This has impacted smaller and medium-sized equities the most due to their lack of liquidity. Thankfully, the fundamentals have been robust enough for many of these equities. Asset outflows typically produce negative returns, but in 2023, despite the outflows, we have seen positive performances out of several equities large and small. Towards the end of the year, we saw some opportunistic M&A play out in our space with Marathon Gold receiving a bid from Calibre Mining and Osino Resources getting swallowed by the cash-rich Dundee Precious Metals. M&A, often involving hefty premiums is quite helpful in attracting eyeballs and capital into a sector. Heading into 2024, precious metal miners are well positioned with strong balance sheets and robust operating margins.
In a sector that has been starved from asset flows for over half a decade, a trickle of capital could be the long-awaited game changer. We are witnessing multiple divergences between fundamentals and investor behavior. Over the long term, fundamentals have a way of asserting themselves. The precious metal sector, starting from bullion all the way down to the equities is marked by low investor sentiment and general disregard. Against this backdrop, the fundamental reasons to own gold, silver and precious metal equities has continued to strengthen. As the sentiment towards this space improves, our suspicion is that it will produce a doozy of a rally, particularly for those invested in the SMID cap precious metal equities.
Maria Smirnova and Shree Kargutkar
Sprott Asset Management
Sub-advisor to the Ninepoint Gold & Precious Minerals Fund,
Ninepoint Gold Bullion Fund and the Ninepoint Silver Fund
1All Ninepoint Gold & Precious Minerals Fund returns and fund details are a) based on Series F units; b) net of fees; c) annualized if period is greater than one year; d) as at December 31, 2023. The index is 100% S&P/TSX Global Gold Total Return Index and is computed by Ninepoint Partners LP based on publicly available index information. 1All Ninepoint Gold Bullion Fund returns and fund details are a) based on Series F units; b) net of fees; c) annualized if period is greater than one year; d) as at December 31, 2023. The index is 100% Global Spot (CAD) Index and is computed by Ninepoint Partners LP based on publicly available index information. 1All Ninepoint Silver Bullion Fund returns and fund details are a) based on Series F units; b) net of fees; c) annualized if period is greater than one year; d) as at December 31, 2023;. The index is 100% Silver Spot (CAD) Index and is computed by Ninepoint Partners LP based on publicly available index information.
The risks associated with investing in a Fund depend on the securities and assets in which the Fund invests, based upon the Fund’s particular objectives. There is no assurance that any Fund will achieve its investment objective, and its net asset value, yield and investment return will fluctuate from time to time with market conditions. There is no guarantee that the full amount of your original investment in a Fund will be returned to you. The Funds are not insured by the Canada Deposit Insurance Corporation or any other government deposit insurer. Please read a Fund’s prospectus or offering memorandum before investing.
Ninepoint Partners LP is the investment manager to the Ninepoint Funds (collectively, the “Funds”). Commissions, trailing commissions, management fees, performance fees (if any), other charges and expenses all may be associated with mutual fund investments. Please read the prospectus carefully before investing. The indicated rate of return for series F units of the Fund for the period ended December 31, 2023 is based on the historical annual compounded total return including changes in unit value and reinvestment of all distributions and does not take into account sales, redemption, distribution or optional charges or income taxes payable by any unitholder that would have reduced returns. Mutual funds are not guaranteed, their values change frequently and past performance may not be repeated. The information contained herein does not constitute an offer or solicitation by anyone in the United States or in any other jurisdiction in which such an offer or solicitation is not authorized or to any person to whom it is unlawful to make such an offer or solicitation. Prospective investors who are not resident in Canada should contact their financial advisor to determine whether securities of the Fund may be lawfully sold in their jurisdiction.
The opinions, estimates and projections (“information”) contained within this report are solely those of Ninepoint Partners LP and are subject to change without notice. Ninepoint Partners makes every effort to ensure that the information has been derived from sources believed to be reliable and accurate. However, Ninepoint Partners assumes no responsibility for any losses or damages, whether direct or indirect, which arise out of the use of this information. Ninepoint Partners is not under any obligation to update or keep current the information contained herein. The information should not be regarded by recipients as a substitute for the exercise of their own judgment. Please contact your own personal advisor on your particular circumstances. Views expressed regarding a particular company, security, industry or market sector should not be considered an indication of trading intent of any investment funds managed by Ninepoint Partners. Any reference to a particular company is for illustrative purposes only and should not to be considered as investment advice or a recommendation to buy or sell nor should it be considered as an indication of how the portfolio of any investment fund managed by Ninepoint Partners is or will be invested. Ninepoint Partners LP and/or its affiliates may collectively beneficially own/control 1% or more of any class of the equity securities of the issuers mentioned in this report. Ninepoint Partners LP and/or its affiliates may hold short position in any class of the equity securities of the issuers mentioned in this report. During the preceding 12 months, Ninepoint Partners LP and/or its affiliates may have received remuneration other than normal course investment advisory or trade execution services from the issuers mentioned in this report.
Views expressed regarding a particular company, security, industry or market sector should not be considered an indication of trading intent of any investment funds managed by Ninepoint Partners LP. These views are not to be considered as investment advice nor should they be considered a recommendation to buy or sell.
Ninepoint Partners LP: Toll Free: 1.866.299.9906. DEALER SERVICES: CIBC Mellon GSSC Record Keeping Services: Toll Free: 1.877.358.0540
Investment Team


Related Funds
Toronto, Ontario M5J 2J1 Canada