 April 30, 2025
Commentary


Monthly Update
Year-to-date to April 30, the Ninepoint Global Infrastructure Fund generated a total return of 2.06% compared to the MSCI World Core Infrastructure Index, which generated a total return of 6.29%. For the month, the Fund generated a total return of -1.72% while the Index generated a total return of -1.27%.
Ninepoint Global Infrastructure Fund - Compounded Returns¹ As of April 30, 2025 (Series F NPP356) | Inception Date: September 1, 2011
1M |
YTD |
3M |
6M |
1YR |
3YR |
5YR |
10YR |
Inception |
|
|---|---|---|---|---|---|---|---|---|---|
Fund |
-1.72% |
2.06% |
-2.32% |
3.23% |
22.07% |
9.78% |
11.24% |
7.41% |
8.32% |
MSCI World Core Infrastructure NR (CAD) |
-1.27% |
6.29% |
3.78% |
5.81% |
22.43% |
7.08% |
8.18% |
7.96% |
10.95% |
President Trump’s Liberation Day of “reciprocal” tariffs has come and gone, having triggered the sharpest equity market selloff since the depths of the Covid-19 crisis in 2020. Investors should be forgiven for feeling that Liberation Day only served to liberate them from some of their capital given the President’s questionable strategy and dubious methodology. The lack of confidence in the current administration and serious concerns regarding US exceptionalism (from an investment point of view), were obvious by the unusual, simultaneous and dramatic decline of US stocks, US Treasury bonds and the US dollar throughout much of April.
However, by mid-month, the President appeared willing to walk back some of his most extreme positions, likely spooked by the selloff in the US Treasury market and extreme volatility across various asset classes. The rapid rise in interest rates was particularly worrisome since the U.S. government is looking to refinance approximately $9 trillion worth of debt this year. We also believe that the US Treasury Secretary, Scott Bessent, was able to successfully convince the President to pause the collection of the reciprocal tariffs for 90 days, at least for countries other than China, giving trade discussions some time to play out. Deregulation and tax reform are potential future tailwinds but, if trade relations don’t improve, most still expect that prices will surge, global growth will slow, and job losses will increase.
Thankfully, the news of a 90-day pause on reciprocal tariffs was enough to trigger a snapback rally in equities, as a sense of relief powered markets back to pre-Liberation Day price levels. We were mildly surprised at the strength of the bounce, since the 10% “baseline” tariffs on all imports from most trade partners remain in effect and the macroeconomic outlook remains murky at best. Further, commentary from corporate leadership teams during the Q1 earnings season highlighted just how difficult it has become to make operating decisions and financial forecasts today. We would point out that the interest rate forward curve is currently pricing in at least three rate cuts in 2025, which should offer some downside support if the outlook continues to deteriorate.
In this environment, we don’t want to panic, but we have reduced outsized allocations to individual stocks and investment themes while remaining invested in a diversified portfolio of dividend paying, high quality companies. We have also begun to add more exposure to Europe across our portfolios, based on improving relative growth expectations and generally better stock valuations after being materially underweight in the past.
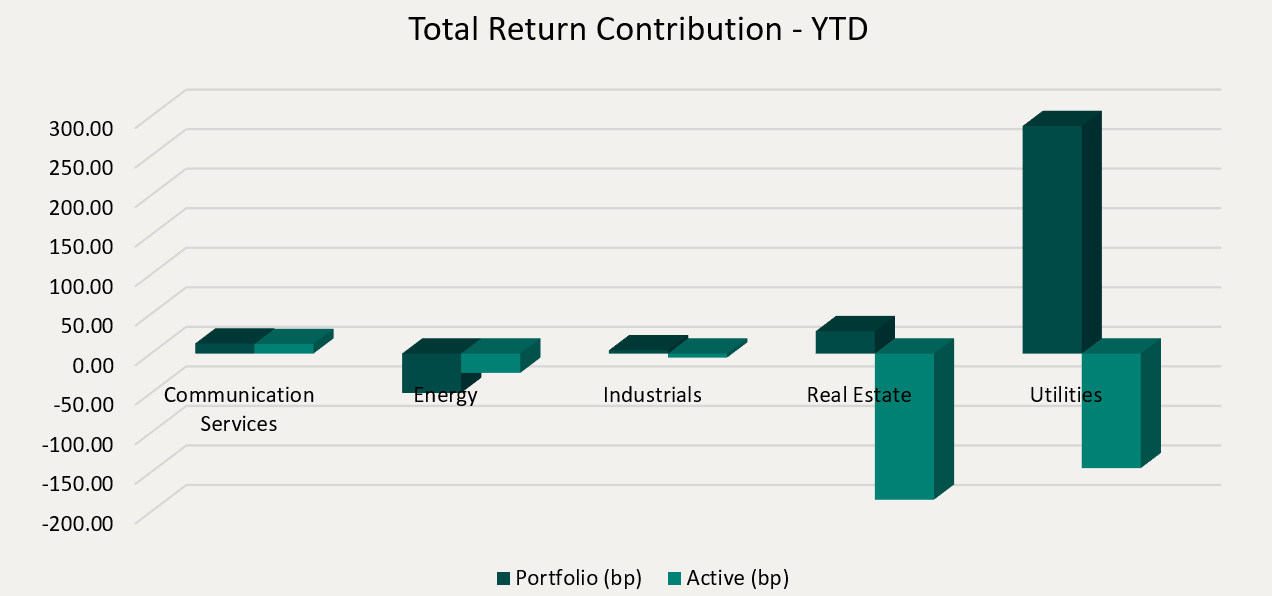
Top contributors to the year-to-date performance of the Ninepoint Global Infrastructure Fund by sector included Utilities (+288 bps), Real Estate (+28 bps) and Communication Services (+13 bps), while only the Energy (-50 bps) sector detracted from performance on an absolute basis.
On a relative basis, only the Communication Services (+12 bps) sector generated a positive return contribution, while negative contributions were generated from the Real Estate (-185 bps), Utilities (-145 bps) and Energy (-24 bps) sectors.
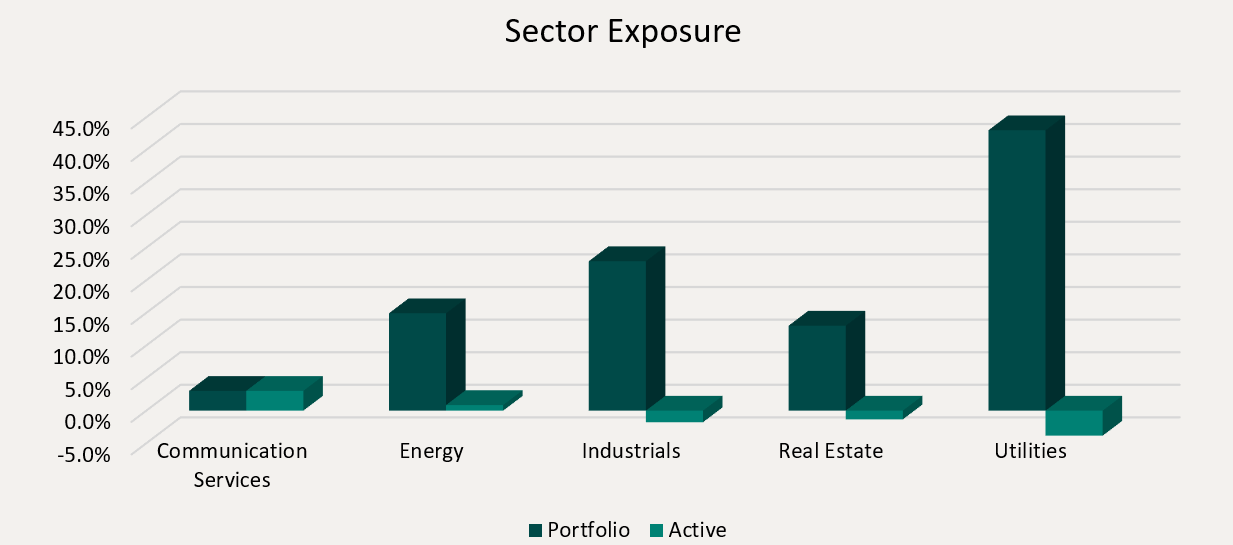
We are currently overweight the Communication and Energy sectors and underweight the Utilities, Industrials and Real Estate sectors. President Trump’s willingness to instigate a global trade war has led to a ferocious selloff in equities and tremendous volatility in the commodity, fixed income and currency markets worldwide. However, early signs that the President was willing to walk back some of his most extreme positions have triggered a snapback rally. Unfortunately, chaos from the administration will likely keep the markets on edge for the foreseeable future. To mitigate the swings, we remain focused on high quality, dividend paying, infrastructure equities that have demonstrated the ability to consistently generate revenue, cash flow and earnings growth through the business cycle.
We continue to believe that the infrastructure asset class is ideally positioned to benefit from the electrification of the US economy and increased fiscal spending on infrastructure in the US and Europe. Importantly, electricity demand is expected to accelerate dramatically, led primarily by the construction of AI-focused data centers and the onshoring of industrial manufacturing. Therefore, we are comfortable having exposure to various infrastructure sub-sectors or sub-industries in the Ninepoint Global Infrastructure Fund that are positioned to benefit from these themes, including traditional energy investments, electrical, natural gas, nuclear & multi-utilities and engineering & construction contractors.
The Ninepoint Global Infrastructure Fund was concentrated in 30 positions as at April 30, 2025 with the top 10 holdings accounting for approximately 37.8% of the fund. Over the prior fiscal year, 20 out of our 30 holdings have announced a dividend increase, with an average hike of 5.2% (median hike of 3.1%). Using a total infrastructure approach, we will continue to apply a disciplined investment process, balancing valuation, growth, and yield in an effort to generate solid risk-adjusted returns.
Jeffrey Sayer, CFA
Ninepoint Partners