 May 31, 2025
Commentary


Monthly Update
Year-to-date to May 31, the Ninepoint Global Infrastructure Fund generated a total return of 2.65% compared to the MSCI World Core Infrastructure Index, which generated a total return of 7.06%. For the month, the Fund generated a total return of 0.57% while the Index generated a total return of 0.73%.
Ninepoint Global Infrastructure Fund - Compounded Returns¹ As of May 31, 2025 (Series F NPP356) | Inception Date: September 1, 2011
1M |
YTD |
3M |
6M |
1YR |
3YR |
5YR |
10YR |
Inception |
|
|---|---|---|---|---|---|---|---|---|---|
Fund |
0.57% |
2.65% |
-1.67% |
-2.29% |
15.71% |
9.96% |
10.50% |
7.50% |
8.31% |
MSCI World Core Infrastructure NR (CAD) |
0.73% |
7.06% |
2.00% |
2.50% |
18.57% |
6.96% |
7.36% |
7.94% |
10.94% |
The broad equity markets have essentially recouped the losses from President Trump’s Liberation Day of “reciprocal” tariffs, in a dramatic “V-shaped” rally. The snapback was triggered, at least in the initial phase, by the President’s willingness to walk back some of his most extreme positions, likely spooked by the selloff in the US Treasury market and extreme volatility across various asset classes. Further, the news that the US and China were willing to de-escalate hostilities, slashing tariffs pending further trade talks, also helped to propel markets higher. Looking forward, deregulation and tax reform are potential future tailwinds, contingent upon a continued improvement in trade relations and negotiated trade deals.
Since our last commentary, investors have taken great comfort in the operating and financial results reported by several key mega-cap growth companies in the Information Technology and Communication Services sectors. These reports were incredibly important to the overall market, since the health of the AI-trade (which had been the biggest driver of investment returns over the past couple of years) was beginning to be calling into question. But the information gleaned from these press releases, financial reports and corporate conference calls generally put fears to rest, at least for now.
Microsoft reported first, announcing 15% revenue and 19% EPS growth, as Azure reaccelerated to 35% revenue growth on the back of strong demand for cloud and AI services. The Company also reaffirmed its commitment to growing capex again in fiscal 2026, from an already eye-popping $80 billion in fiscal 2025. Meta reported that same night, posting 19% revenue and 37% EPS growth, as daily active persons on their platforms grew 6% to 3.43 billion. Importantly, the Company raised capex guidance, to a range of $64 to $72 billion from a prior range of $60 to $65 billion, reflecting additional data centre investments to support the growth of AI-powered features. A day later, Amazon reported 10% revenue and an impressive 62% EPS growth, as AWS grew 17% in the quarter to an approximate $117 billion annualized revenue run rate. The company spent almost $25 billion capex in the quarter, to support a backlog of about $189 billion for AWS (up 20%), as of Q1 2025.
Unlike prior periods of hypergrowth in new technologies, these capital expenditures are being funded by billions of dollars’ worth of cash on each of the company’s balance sheets, not through debt or equity issuances, reducing the risk of wasteful spending. The most obvious beneficiary of this capex cycle reported on May 28th, with Nvidia locking in 69% revenue and 33% EPS growth, on the back of data centre revenue growth of 73% to $39.1 billion. Jensen Huang, the Company’s charismatic founder and CEO, was clear that Nvidia’s latest GPU (known as Blackwell) was now in full scale production, alleviating fears of an air pocket in quarterly sales. He also pointed to four key positive surprises regarding AI adoption that should power sales in the coming quarters: the Company was seeing a broad step up in AI demand, the AI diffusion rule had been rescinded, enterprise agents were gaining traction and industrial AI use cases were accelerating. These results went a long way in terms of validating the nascent equity rally, especially across the sectors tied to the AI trade, including technology, communication services, industrials and some utilities.
Despite the exceptional results from mega-cap tech, commentary from most corporate leadership teams during the Q1 earnings season highlighted just how difficult it has become to make operating decisions and financial forecasts today. In this environment, we have reduced outsized allocations to individual stocks and investment themes while remaining invested in a diversified portfolio of dividend paying, high quality companies. We have also added more exposure to Europe across our portfolios, based on improving relative growth expectations and generally better stock valuations after being materially underweight in the past. Finally, we would point out that the interest rate forward curve is currently pricing in about two rate cuts in 2025, which should offer some downside support if the outlook deteriorates.
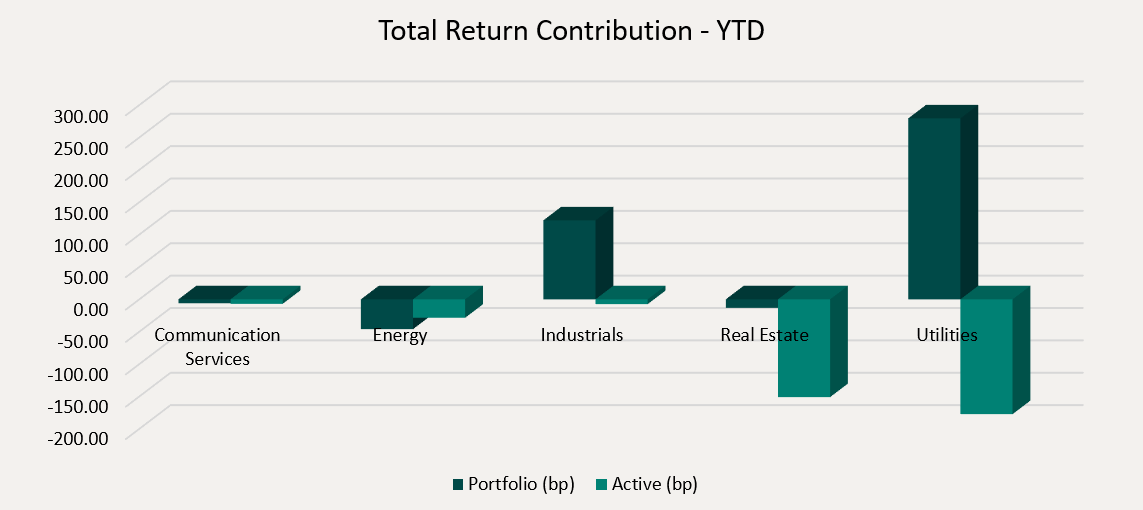
Top contributors to the year-to-date performance of the Ninepoint Global Infrastructure Fund by sector included Utilities (+279 basis points) and Industrials (+122 basis points), while the Energy (-46 basis points), Real Estate (-13 basis points) and Communication Services (-6 basis points) sectors detracted from performance on an absolute basis.
On a relative basis, negative contributions were generated from the Utilities (-177 basis points), Real Estate (-151 basis points) and Energy (-28 basis points) sectors.
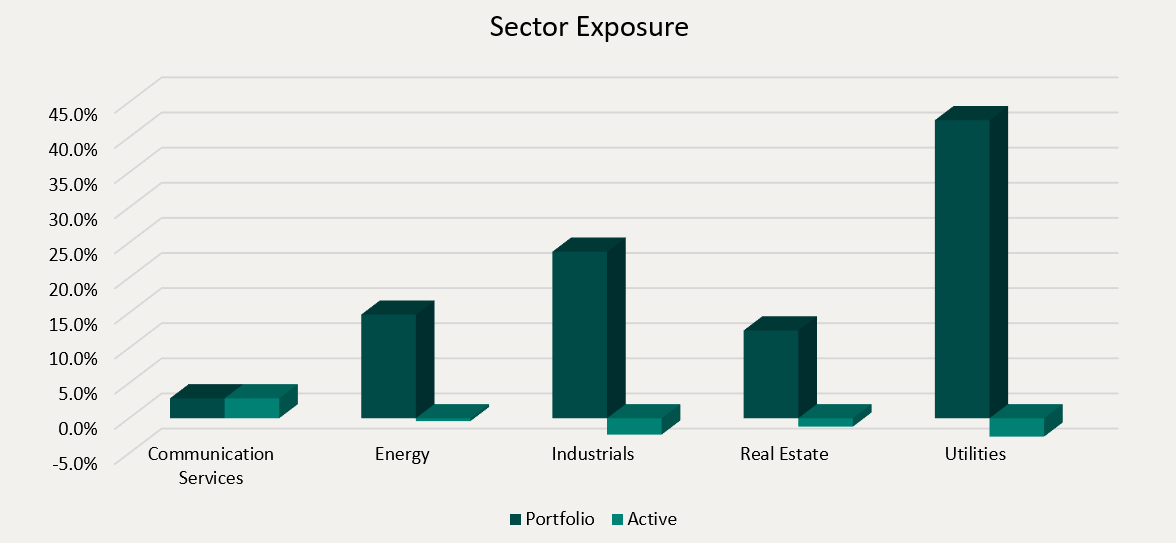
We are currently overweight the Communication Services sector and underweight the Utilities, Industrials and Real Estate sectors Despite President Trump’s willingness to instigate a global trade war, signs that the President was willing to walk back some of his most extreme pronouncements have triggered a snapback rally. However, we will be closely watching incoming data for any evidence that the chaos has damaged the labour market and/or future economic growth. To mitigate the risks, we remain focused on high quality, dividend paying, infrastructure equities that have demonstrated the ability to consistently generate revenue, cash flow and earnings growth through the business cycle.
We continue to believe that the infrastructure asset class is ideally positioned to benefit from the electrification of the US economy and increased fiscal spending on infrastructure in the US and Europe. Importantly, electricity demand is expected to accelerate dramatically, led primarily by the construction of AI-focused data centers and the onshoring of industrial manufacturing. Therefore, we are comfortable having exposure to various infrastructure sub-sectors or sub-industries in the Ninepoint Global Infrastructure Fund that are positioned to benefit from these themes, including traditional energy investments, electrical, natural gas, nuclear & multi-utilities and engineering & construction contractors.
The Ninepoint Global Infrastructure Fund was concentrated in 30 positions as at May 31, 2025 with the top 10 holdings accounting for approximately 37.8% of the fund. Over the prior fiscal year, 25 out of our 30 holdings have announced a dividend increase, with an average hike of 9.0% (median hike of 5.8%). Using a total infrastructure approach, we will continue to apply a disciplined investment process, balancing valuation, growth, and yield in an effort to generate solid risk-adjusted returns.
Jeffrey Sayer, CFA
Ninepoint Partners