 August 31, 2025
Commentary


Monthly Update
Year-to-date to August 31, the Ninepoint Global Infrastructure Fund generated a total return of 2.78% compared to the MSCI World Core Infrastructure Index, which generated a total return of 8.88%. For the month, the Fund generated a total return of -2.02% while the Index generated a total return of 0.25%.
Ninepoint Global Infrastructure Fund - Compounded Returns¹ As of August 31, 2025 (Series F NPP356) | Inception Date: September 1, 2011
1M |
YTD |
3M |
6M |
1YR |
3YR |
5YR |
10YR |
Inception |
|
|---|---|---|---|---|---|---|---|---|---|
Fund |
-2.02% |
2.78% |
0.13% |
-1.54% |
11.33% |
8.65% |
9.95% |
8.03% |
8.16% |
MSCI World Core Infrastructure NR (CAD) |
0.25% |
8.88% |
1.70% |
3.73% |
11.77% |
7.80% |
8.41% |
8.20% |
10.87% |
The S&P 500 pushed to a new all-time high in August, as better than expected Q2 revenue and earnings and hopes of a September rate cut kept the momentum going. According to FactSet, earnings estimates for Q3 have been rising, with earnings growth of 7.5% now expected, up from 7.2% as of June 30, led by the Information Technology, Utilities, Materials and Industrial sectors. So far, most industries and companies have been able to protect margins and profits from the impact of tariffs, but recently some retailers and manufacturers are beginning to warn of a greater impact over the balance of the year.
Concerningly, after a surprisingly weak July jobs report (with only 73,000 jobs added in July and shockingly bad prior-period revisions), the August job report was also disappointing with only 22,000 jobs added. As a result, calls for interest rate cuts have grown (including most vocally from President Trump) and the forward curve is currently implying a 100% chance of a 25-basis points cut in September and slightly less than three cuts of 25-basis points each before the end of the year. Again, it appears that we are in a “no-fire but no-hire” jobs market, where employers are reluctant to fire employees but if they do, job seekers are having a very difficult time finding work. We really hope that the rate cuts come in time to protect the jobs market from any further deterioration, especially since consumers from lower-income households seem to be under some pressure.
Globally, signs of stress are appearing in the bond markets, notably in the UK (related to concerns regarding the government’s ability to meet its budget without tax increases or spending cuts) and in France (ahead of a confidence vote that may collapse the current government). Thankfully, yields in the US have remained well-behaved as potential rate cuts, deregulation, tax reform and fiscal stimulus are supportive. Rightly or wrongly, as per FactSet, the US equity markets are still unconcerned (trading at 22x forward earnings compared to the 5-average of 20x and the 10-year average of 18.5x). Given this set up, it will be very interesting to see how the equity markets perform through the typically seasonally weak September to October period. To be proactive, we have reduced outsized allocations to individual stocks and investment themes while remaining invested in a broadly diversified portfolio, in case a growth scare materializes over the next couple of months.
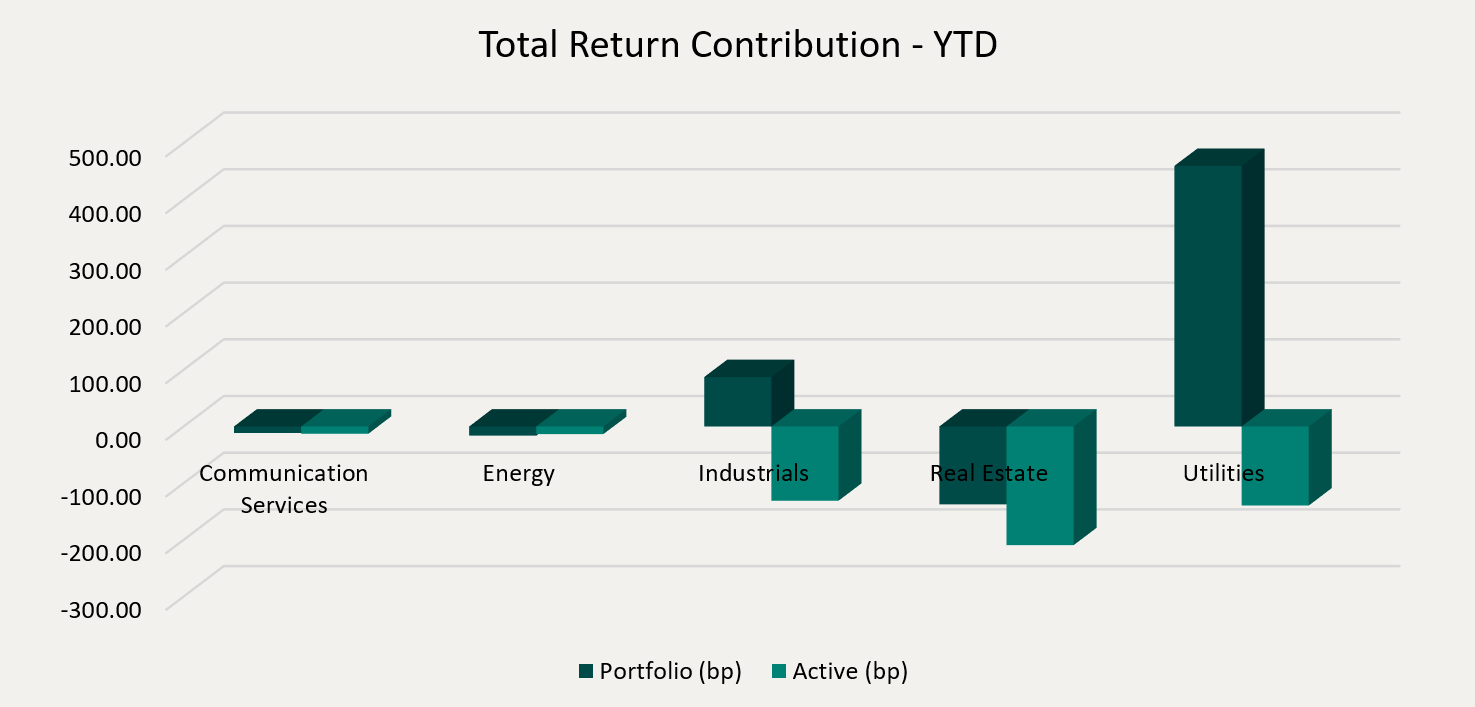
Top contributors to the year-to-date performance of the Ninepoint Global Infrastructure Fund by sector included Utilities (+460 basis points) and Industrials (+87 basis points), while the Real Estate (-138 basis points), Energy (-16 basis points) and Communication Services (-12 basis points) sectors detracted from performance on an absolute basis.
On a relative basis, negative contributions from the Real Estate (-209 basis points), Utilities (-139 basis points) and Industrials (-131 basis points) sectors detracted from performance.
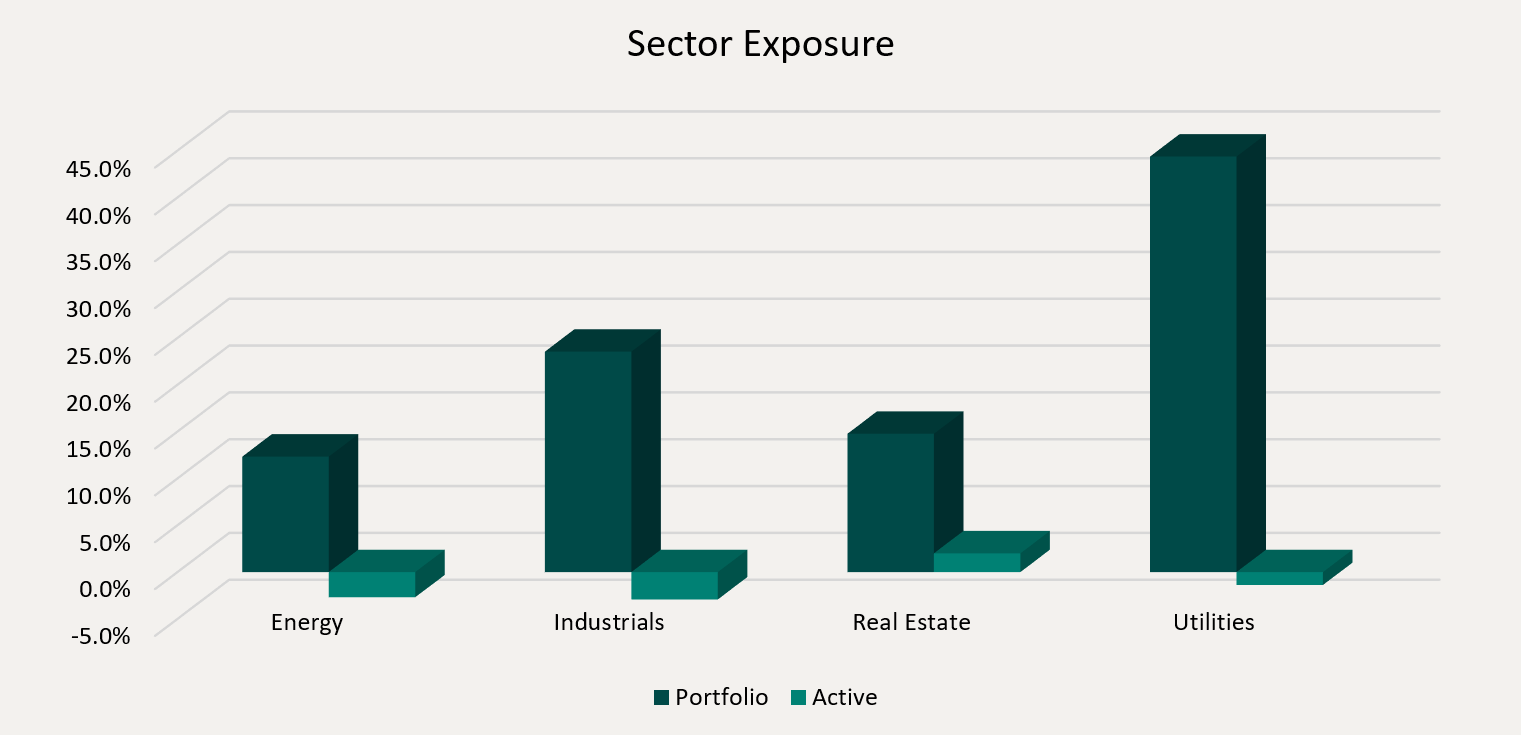
We are currently overweight the Real Estate sector and underweight the Industrials, Energy and Utilities sectors. As the market continues to defy expectations and reach all-time highs, we are closely watching incoming data (particularly related to the US labour market) for evidence that the Trump administration’s policies have done damage to the economy. To mitigate the risks, we remain focused on high-quality, dividend paying infrastructure equities that have demonstrated the ability to consistently generate revenue, cash flow and earnings growth through the business cycle.
We continue to believe that the infrastructure asset class is ideally positioned to benefit from the electrification of the global economy and increased fiscal spending on infrastructure in Canada, the US and Europe. Importantly, electricity demand is expected to accelerate dramatically, led primarily by the construction of AI-focused data centers globally and the onshoring of industrial manufacturing in the US. Therefore, we are comfortable having exposure to various infrastructure sub-sectors or sub-industries in the Ninepoint Global Infrastructure Fund that are positioned to benefit from these themes, including traditional energy investments, electrical, natural gas, nuclear & multi-utilities and engineering & construction contractors.
The Ninepoint Global Infrastructure Fund was concentrated in 29 positions as at August 31, 2025, with the top 10 holdings accounting for approximately 37.0% of the fund. Over the prior fiscal year, 24 out of our 29 holdings have announced a dividend increase, with an average hike of 8.0% (median hike of 5.9%). Using a total infrastructure approach, we will continue to apply a disciplined investment process, balancing valuation, growth, and yield in an effort to generate solid risk-adjusted returns.
Jeffrey Sayer, CFA
Ninepoint Partners