 June 30, 2025
Commentary


The monthly commentary discusses recent developments across the Ninepoint Diversified Bond, Ninepoint Alternative Credit Opportunities and Ninepoint Credit Income Opportunities Funds.
Macro
As we have now reached the midpoint of the year, we thought we could take stock of what has happened before reflecting on what could happen in the second half. The table below shows the year-to-date change in some of the key variables impacting North American fixed income investors.
Starting with interest rates in the top half of the table, some might be surprised to learn that, while the Bank of Canada did cut rates by 50 basis points, the Canadian bond market underperformed the U.S., where the Fed has remained on hold so far this year. Canadian 5-year rates barely declined (2 basis points), but 10 and 30-year rates have increased. How could that be? Well, a lot depends on what information is priced-in, and as the year progressed, sticky core inflation has meant investors now expect fewer rate cuts by the BoC later this year (only one more cut priced in for the rest of 2025). Also, monetary policy only has a marginal impact on longer term rates, which tend to reflect other factors such as inflation expectations and government deficits. In other words, the Canadian yield curve steepened, as investors priced out further rate cuts by the BoC and expectations for sticky inflation have materialized. Elevated deficits with the new Liberal Government are also putting pressure on long-term rates.
In the U.S., the Fed remains on hold; inflation still remains too high for comfort, and the economy has slowed but not enough to warrant emergency cuts. But policy uncertainty and associated trade war has led the market (and the Fed) to revise down growth expectations for 2025, and by extension, for the market to price-in more rate cuts by the Fed (two cuts priced-in for 2025). That is why 5-year rates have declined by 48 basis points year-to-date, but further out the curve, 10-year rates only declined 18 basis points while 30-year bonds saw their yield increase by 14 basis points.
Changes year-to-date:
Canada |
U.S. |
|
|---|---|---|
Overnight Rate |
-50bps |
0bps |
5-year |
-2bps |
-42bps |
10-year |
+18bps |
-18bps |
30-year |
+36bps |
+14bps |
IG Credit |
-4bps |
-3bps |
HY Credit |
N/A |
-14bps |
Canadian Dollar vs USD |
+5.4% |
N/A |
Source: Bloomberg. Change from December 31, 2024 to July 7, 2025.
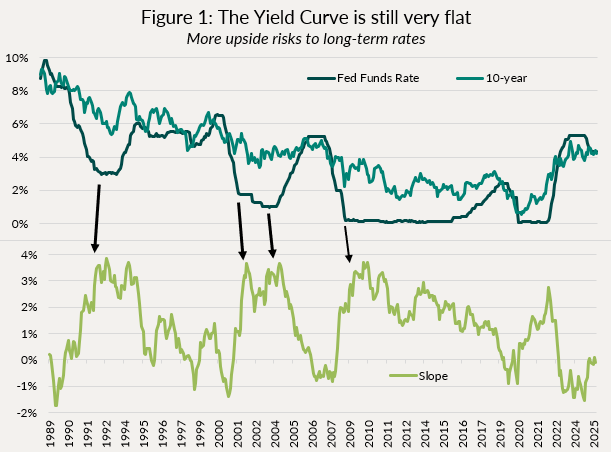
This theme of steeper yield curves (long term rates getting progressively higher than short term rates) is here to stay. For the past two years, we had an inverted yield curve, as monetary policy was restrictive. As central banks normalize policy, it is “normal” for the yield curve to be upward sloping, and we have a long way to go before we are back to historical norms.
Figure 1 below shows the relationship between the Fed Funds Rate (overnight rate) and the 10-year yield. The top panel shows outright yield levels, and the bottom panel shows the difference (i.e. the slope). At about 5 basis points, the current slope of the curve is still very flat. Historically, we find that the curve is at its steepest right around the end of the rate cut cycle, and often reaches as much as 3-4%. Add that to your target for the Fed Funds Rate at the end of the cutting cycle, and you have a 10-year yield that will likely be above current levels. The same historical relationship holds true for Canadian rates.
Notwithstanding all of the institutional and idiosyncratic factors that are pushing yield curves steeper (large deficits, loss of confidence in U.S. institutions, rewiring of the global trade order, etc.), history alone would suggest pressure on long-term rates is here to stay, despite central banks cutting rates. That is why we have been focused on 5-year and shorter bonds to gain exposure to rate cuts. Starting last summer with a focus on Canada (where we saw more potential for faster cuts as the economy was weaker here), and then this spring switching to the U.S. for rate cut exposure. Going further out the curve, in our view, presents more risks that rewards, and we will avoid that part of the curve until the U.S. and Canadian yield curves have normalized.
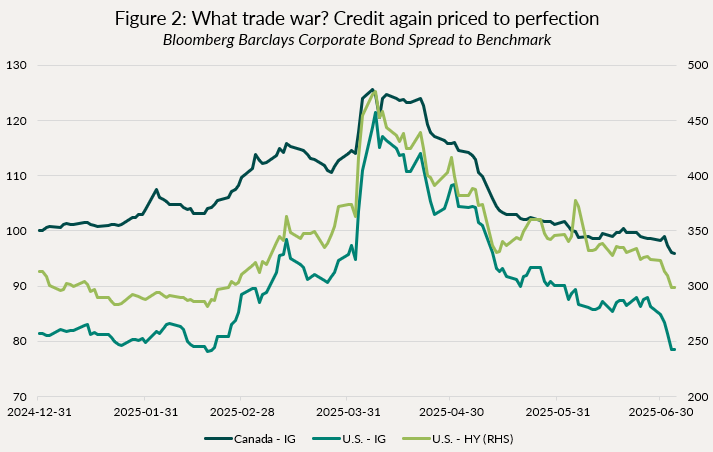
Now for some commentary on the bottom half of the table above, namely the movements in credit spreads and the currency. At the start of the year, we argued that IG and HY credit spreads, on both sides of the border, were priced to perfection, particularly given the dark clouds forming on the horizon over the trade war. Fast forward to today, and credit spreads are tighter than they were at the start of the year, while the trade war is again heating up (Figure 2). Suffice to say, we are, and will remain, in defensive mode with regards to credit exposure. That doesn’t mean that we can’t find attractive securities to add to the portfolios. Our focus has remained on higher credit quality (all funds have an average rating of A-) and shorter credit duration (credit duration ranges between 1.6 and 2.8 years). We want to be able to act from a position of strength when opportunities arise.
Finally: the Loonie. Since the U.S. Election last November, we have introduced a small amount of exposure to the US dollar in our funds (about 7%). The U.S. dollar strengthened about 4% vs the Loonie from Nov24 to Dec24. However, with the trade war and the other destabilising actions being taken by the U.S. administration, we have seen a loss of confidence in the Greenback and a depreciation against most major currencies (+5.4% for the Loonie), as the end of U.S. exceptionalism drove a wave of currency hedging by foreign investors. Thankfully, we had hedged the majority of our USD positions with FX options, in essence collaring them (sell call, buy put spread) at a very low cost. Given this depreciation, our puts are now in the money, and the funds are essentially fully hedged at current levels, with some upside should the USD re-appreciate. We will continue to carefully monitor these developments and maintain a very tight currency hedging program.
One thing is clear, through all the volatility of the past 6 months, fixed income has kept true to its word, offering stability in investors portfolio. Our funds have been positive all year, and remain well positioned to perform their role of capital preservation and reasonable income in this challenging environment.
Individual Fund Discussion
Ninepoint Diversified Bond Fund
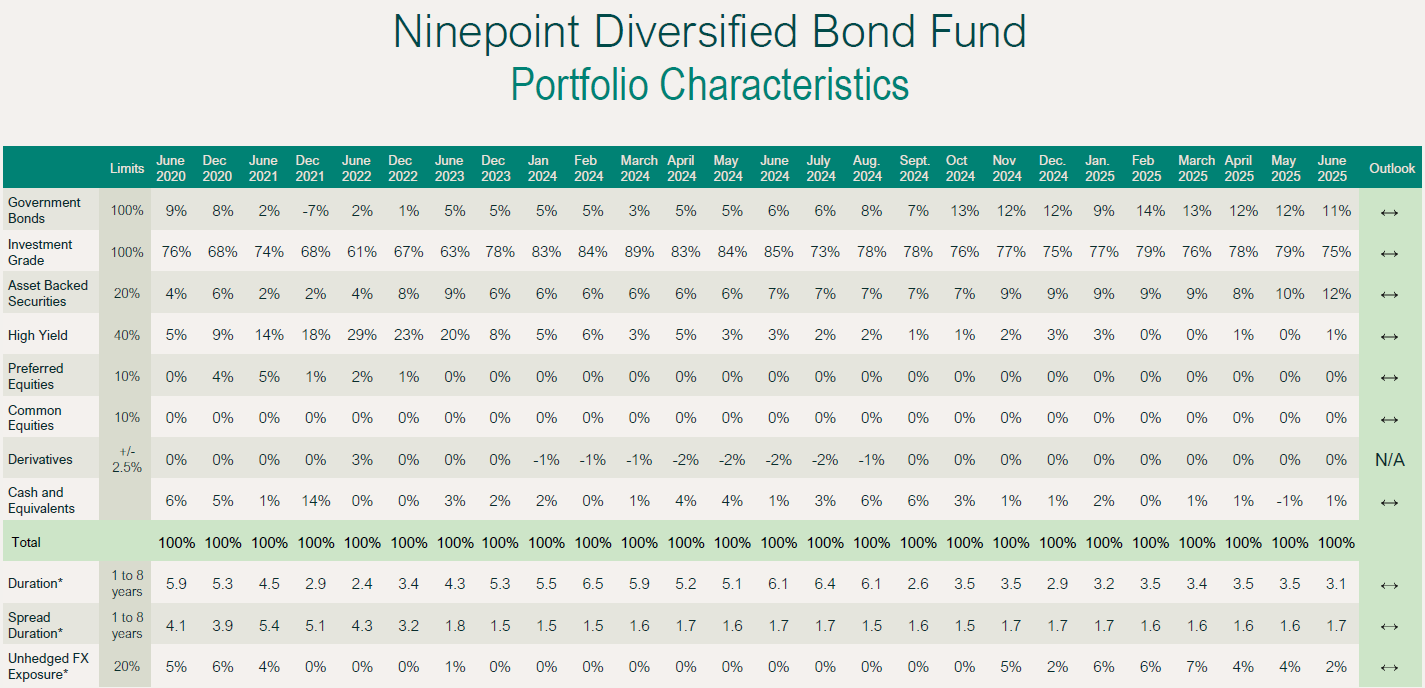
The fund finished the first half of the year up 2.08%, net of fees. There are obviously a lot of moving parts, but generally, we have earned our carry (portfolio yield has been roughly 4%) and offset our fees and expenses with small gains in duration. We did see more meaningful gains following Liberation Day, as our hedges worked in our favour, but this quickly retraced as the market completely reversed course.
We have continued to add to high-quality US credit (FX hedged), as we see more value there than in $C. Overall, we remain quite defensively positioned in credit (spread duration 1.7 years).
As for duration, we have continued to shift more rate exposure to the US market, as we believe they have much more room to cut, and the damage from the trade war will eventually force the Fed’s hand into cutting. Still, at 3.1 years of duration, this is a very measured risk we are taking.
NINEPOINT DIVERSIFIED BOND FUND - COMPOUNDED RETURNS¹ AS OF JUNE 30, 2025 (SERIES F NPP118) | INCEPTION DATE: AUGUST 5, 2010
1M |
YTD |
3M |
6M |
1YR |
3YR |
5YR |
10YR |
Inception |
|
|---|---|---|---|---|---|---|---|---|---|
Fund |
0.35% |
2.08% |
0.08% |
2.08% |
8.21% |
4.88% |
1.49% |
2.63% |
3.55% |
Ninepoint Alternative Credit Opportunities Fund
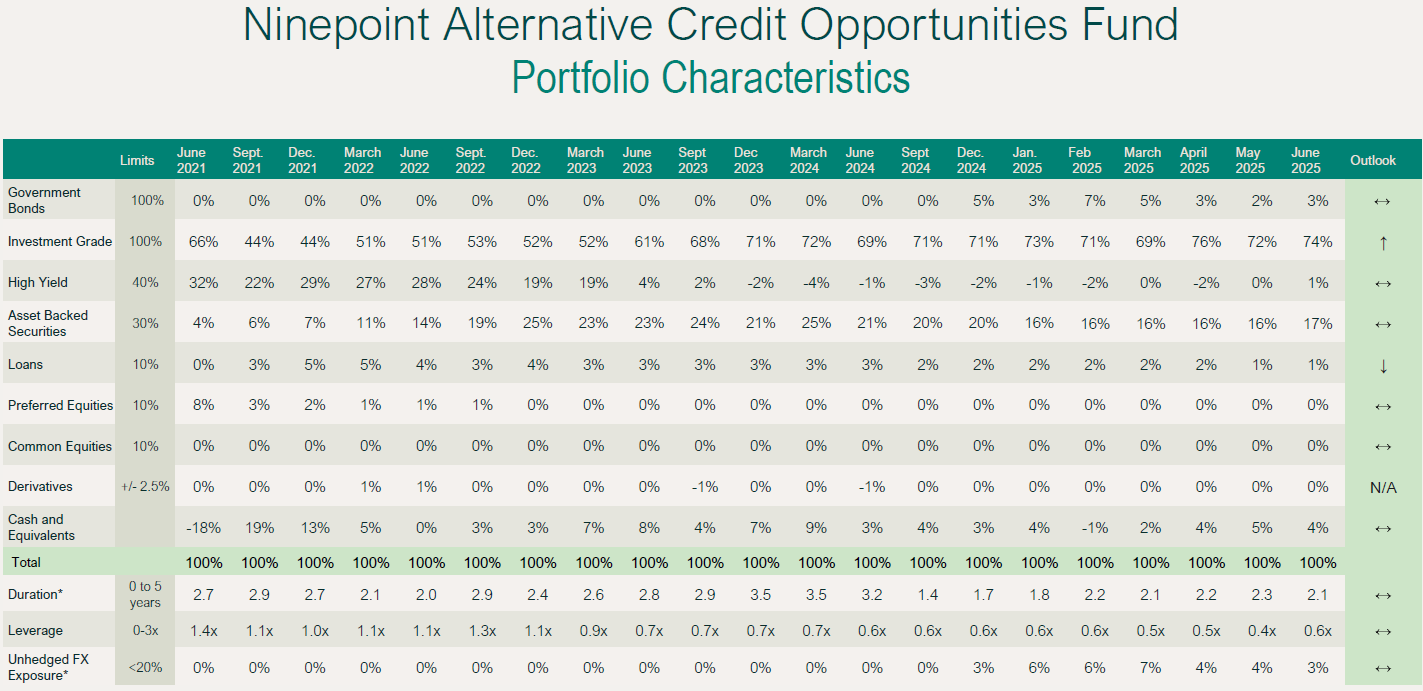
For the first half of the year, the fund returned 1.68% net of fees. Considering we have had a portfolio yield of just over 5% all year, this is a bit below expectations. Two factors explain this divergence. First, we have a larger credit hedging program in this fund than with the Diversified Bond Fund (DBF). We are short the U.S. High Yield index, and have relative value positions that should benefit in the event of credit spread widening. Both those hedges have worked against us this year, detracting slightly from performance. Secondly, we do not have much exposure to interest rates in this fund, with a duration of only about 2-years, so we did not see the same gains as with the DBF.
We have continued to add to high-quality US credit (FX hedged or rates hedged), as we see more value there than in $C. Overall, we remain quite defensively positioned in credit (spread duration 3.1 years, leverage 0.55x).
As for duration, while modest, we have continued to shift more rate exposure to the US market, as we believe they have much more room to cut, and the damage from the trade war will eventually force the Fed’s hand into cutting. Still, at 2.1 years of duration, this is a very small risk we are taking.
NINEPOINT ALTERNATIVE CREDIT OPPORTUNITIES FUND - COMPOUNDED RETURNS¹ AS OF JUNE 30, 2025 (SERIES F NPP931) | INCEPTION DATE: APRIL 30, 2021
1M |
YTD |
3M |
6M |
1YR |
3YR |
Inception |
|
|---|---|---|---|---|---|---|---|
Fund |
0.42% |
1.68% |
0.25% |
1.68% |
6.73% |
6.12% |
2.59% |
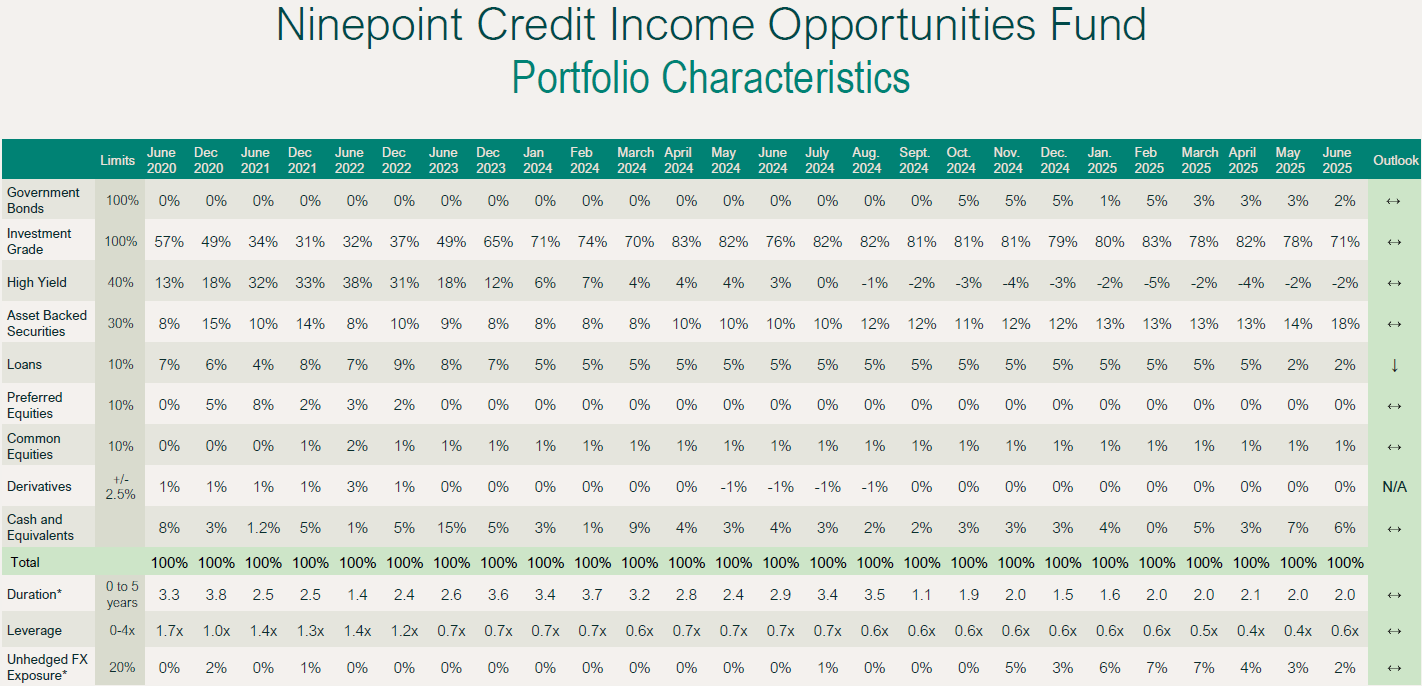
Ninepoint Credit Income Opportunities Fund
Other than returning 1.76% vs 1.68% for the Ninepoint Alternative Credit Opportunities fund, the discussion for the Credit Income Opportunities fund is essentially the same, so we would refer readers to the previous section. These two funds are managed to the same strategy.
NINEPOINT CREDIT INCOME OPPORTUNITIES FUND - COMPOUNDED RETURNS¹ AS OF JUNE 30, 2025 (SERIES F NPP507) | INCEPTION DATE: JULY 1, 2015
1M |
YTD |
3M |
6M |
1YR |
3YR |
5YR |
10YR |
Inception |
|
|---|---|---|---|---|---|---|---|---|---|
Fund |
0.36% |
1.76% |
0.27% |
1.76% |
6.61% |
6.44% |
5.78% |
4.92% |
4.92% |
Conclusion
Have a good summer, it’s hot and heating up! We continue to be all hands on deck.
Until next month,
Mark, Etienne & Nick
As always, please feel free to reach out to your product specialist if you have any questions.