 July 31, 2025
Commentary


Monthly Update
Year-to-date to July 31, the Ninepoint Global Infrastructure Fund generated a total return of 4.90% compared to the MSCI World Core Infrastructure Index, which generated a total return of 8.61%. For the month, the Fund generated a total return of 0.93% while the Index generated a total return of 0.92%.
Ninepoint Global Infrastructure Fund - Compounded Returns¹ As of July 31, 2025 (Series F NPP356) | Inception Date: September 1, 2011
1M |
YTD |
3M |
6M |
1YR |
3YR |
5YR |
10YR |
Inception |
|
|---|---|---|---|---|---|---|---|---|---|
Fund |
0.93% |
4.90% |
2.78% |
0.39% |
15.58% |
10.03% |
10.12% |
7.73% |
8.37% |
MSCI World Core Infrastructure NR (CAD) |
0.92% |
8.61% |
2.19% |
6.05% |
13.29% |
7.34% |
8.08% |
7.85% |
10.92% |
Markets continue to climb a wall of worry, as fears of a post-liberation day worst-case scenario have yet to play out. Thus far, most industries and companies (barring a few notable exceptions such as automotive manufacturers) have been able to rely on selling current inventory and sharing the cost of tariffs with downstream suppliers to protect profit margins and earnings as best as possible. Importantly, the AI-trade is alive and well, with the key cloud hyperscalers and those responsible for the technology infrastructure buildout continuing to outperform, supporting the equity markets at the index level.
As we write this commentary, with 90% of the S&P 500 companies having reported actual results, 81% of companies reported a positive revenue surprise and (perhaps coincidentally) 81% of companies reported a positive EPS surprise. Heading into the earnings season, consensus estimates only called for 4.9% EPS growth, so the bar was set quite low. However, the blended year-over-year earnings growth rate is coming in at 11.8%, well above these initial expectations. Given the investment themes that we have discussed in the past, it is no surprise that the Communication Services, Information Technology, and Financials sectors have reported the biggest EPS growth numbers. But as the equity indexes push relentlessly higher, we are mindful that the forward 12-month P/E ratio for the S&P 500 is approximately 22.1x, above the 5-year average (19.9x) and above the 10-year average (18.5x), all according to FactSet.
Looking forward, deregulation, tax reform and fiscal stimulus are potential tailwinds, with President Trump’s “Mega Bill” signed into law on July 4th. Further, calls for interest rate cuts from President Trump have grown louder and louder and, despite the Fed remaining on hold at its July meeting, two members of the Federal Reserve’s Open Market Committee dissented on holding interest rates steady, voting to lower rates instead. Interestingly, the subsequent Non-Farm Payrolls report was surprisingly weak, with only 73,000 jobs added in July (below expectations of 110,000 jobs) and prior period revisions were shockingly bad, with May jobs data revised from +144,000 to +19,000 and June jobs data revised from +147,000 to just +14,000. Looking at the initial jobless claims and continued claims data, it appears that we are in a “no-fire but no-hire” jobs market, where employers are reluctant to fire employees, but if they do, job seekers are having a very difficult time finding work.
With the weak jobs report, the forward curve is currently implying a 90% chance of a 25 basis points cut in September and a 100% of at least two 25 basis points cuts by the end of the year. We really hope that the rate cuts come in time to protect the jobs market from any further deterioration, especially since consumers from lower-income households seem to be under some pressure. In this environment, we have reduced outsized allocations to individual stocks and investment themes while remaining invested in a broadly diversified portfolio, in case a growth scare materializes over the next few months.
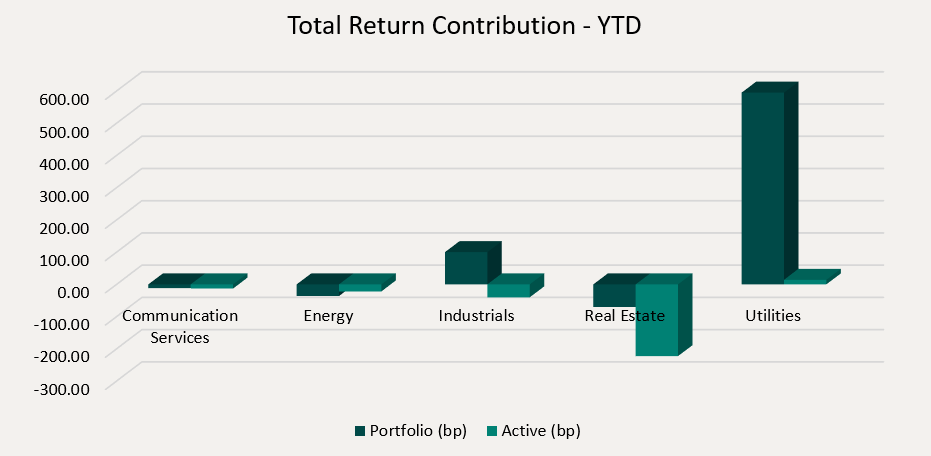
Top contributors to the year-to-date performance of the Ninepoint Global Infrastructure Fund by sector included Utilities (+595 basis points) and Industrials (+100 basis points), while the Real Estate (-70 basis points), Energy (-36 basis points) and Communication Services (-12 basis points) sectors detracted from performance on an absolute basis.
On a relative basis, a positive return contribution from the Utilities (+14 basis points) sector was offset by negative contributions from the Real Estate (-223 basis points), Industrials (-40 basis points) and Energy (-22 basis points) sectors.
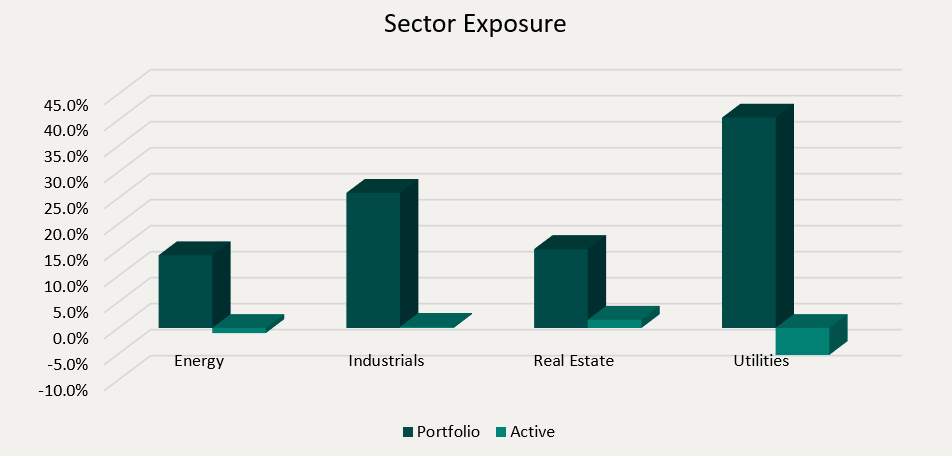
We are currently slightly overweight the Real Estate sector, market weight the Industrials sector and underweight the Energy and Utilities sectors. As the market continues to recover from its April lows, we are closely watching incoming data for any evidence that the Trump administration’s policies have damaged the labour market and/or future economic growth. To mitigate the risks, we remain focused on high quality, dividend paying infrastructure equities that have demonstrated the ability to consistently generate revenue, cash flow and earnings growth through the business cycle.
We continue to believe that the infrastructure asset class is ideally positioned to benefit from the electrification of the US economy and increased fiscal spending on infrastructure in Canada, the US and Europe. Importantly, electricity demand is expected to accelerate dramatically, led primarily by the construction of AI-focused data centers globally and the onshoring of industrial manufacturing in the US. Therefore, we are comfortable having exposure to various infrastructure sub-sectors or sub-industries in the Ninepoint Global Infrastructure Fund that are positioned to benefit from these themes, including traditional energy investments, electrical, natural gas, nuclear & multi-utilities and engineering & construction contractors.
The Ninepoint Global Infrastructure Fund was concentrated in 30 positions as at July 31, 2025, with the top 10 holdings accounting for approximately 36.8% of the fund. Over the prior fiscal year, 25 out of our 30 holdings have announced a dividend increase, with an average hike of 8.5% (median hike of 5.8%). Using a total infrastructure approach, we will continue to apply a disciplined investment process, balancing valuation, growth, and yield in an effort to generate solid risk-adjusted returns.
Jeffrey Sayer, CFA
Ninepoint Partners