 August 31, 2025
Commentary


Year-to-date to August 31, the Ninepoint Crypto and AI Leaders ETF generated a total return of 20.09%. For the month, the Fund generated a total return of -1.43%.
Ninepoint Crypto And AI Leaders ETF - Compounded Returns¹ As of August 31, 2025 (Series ETF USD- TKN.U) | Inception Date: January 27, 2021
1M |
YTD |
3M |
6M |
1YR |
3YR |
Inception |
|
|---|---|---|---|---|---|---|---|
Fund |
-1.43% |
20.09% |
25.07% |
42.96% |
58.39% |
49.80% |
16.57% |
Following three straight months of double-digit percentage gains, sectoral momentum across crypto and AI cooled in August, leading to the Fund’s first monthly decline since March. The Fund fell 1.43% during the month, following one of the strongest runs since its inception.
While Bitcoin closed August down 4.4%, the Fund’s diversified mix of core cryptoassets and crypto- and AI-related equities proved resilient and defensive. According to TradingView, nine of the Fund’s holdings, approximately 54.9% of the portfolio, outperformed Bitcoin: Hut 8 (+36.2%), Ethereum (+27.9%), Solana (+24.6%), Robinhood (+6.9%), Mastercard (+4.8%), Broadcom (+3.1%), PayPal (+2.2%), Nvidia (-0.3%), and Roblox (-3.2%). By contrast, just five of the Fund’s sixteen holdings outpaced the Nasdaq’s 3.1% return, as many sector-specific equities consolidated after months of strength. Consistent with what we’ve observed throughout 2025, leadership rotated once again. This past month it was Ethereum, Solana, and Hut 8 that stood out.
As a reminder, our strategy seeks to capture the full breadth of potential of AI and Crypto through a three-pronged approach, offering diversified exposure to:
- Growth in digital asset platforms, like Bitcoin, Ethereum, and Solana, is indirectly via listed Canadian cryptocurrency ETFs
- Pure-play crypto and AI businesses
- High-quality growth tech beneficiaries
Capping off August was one of the market’s most anticipated events of the summer: Nvidia’s Q2 FY25 earnings results. Expectations were high given the company’s central role in powering the AI boom, and Wall Street was watching closely to see whether the momentum would continue. Nvidia beat on sales ($46.7B vs. $46.1B estimate) and EPS ($1.05 vs. $1.01 estimate) but fell just short of some other lofty expectations. Quarterly data center revenue of $41.1B narrowly missed the $41.3B estimate, and management didn’t raise guidance, instead projecting Q3 revenue of about $54B, broadly in line with consensus. That raised concerns that the AI spending boom may be cooling. Still, CEO Jensen Huang struck an upbeat tone, declaring the “AI race is on” and pointing to overwhelming demand for its next generation GPUs. Nvidia also excluded China revenue from its forecast due to regulatory uncertainty, noting that including it would have added an estimated $2B to $5B to quarterly sales. Despite the wobble, Nvidia remains the undisputed hardware supplier of the AI economy and the world’s largest public company, with a market cap of $4.4T. It is larger than the entire German stock market combined and represents 8% of the S&P 500 and 10% of the Nasdaq.
The AI buildout is transforming whole sectors, reshaping the power grid, fueling a hiring boom with staggering compensation, lifting the fortunes of communities benefiting from the data center surge, changing labor markets, spilling over into the U.S.–China tech rivalry, and driving economic growth in ways few predicted less than three years ago when ChatGPT emerged. After decades of stagnant growth, power demand surged 4.3% last year, more than double the annual average over the past decade. Utilities are racing to respond. For example, Dominion will spend $50B to expand Virginia’s grid, while American Electric Power is courting hyperscalers across Texas and Ohio. In Canada, Hydro One and Brookfield are positioning to capture demand, with Brookfield already signing a 10.5 GW renewable contract with Microsoft. There is now a rush to own the infrastructure of the AI era. McKinsey estimates that by 2030, data centers will require $6.7T worldwide to meet demand for computing power, spending that will reshape the global economy. Already, GDP data shows AI data center construction contributing more to growth than the entire U.S. consumer. Some worry the boom is more of a sugar rush than a long feast, since once operational, data centers require relatively few employees. But Nvidia’s results show demand remains strong, and for now, the AI future is being built at scale.
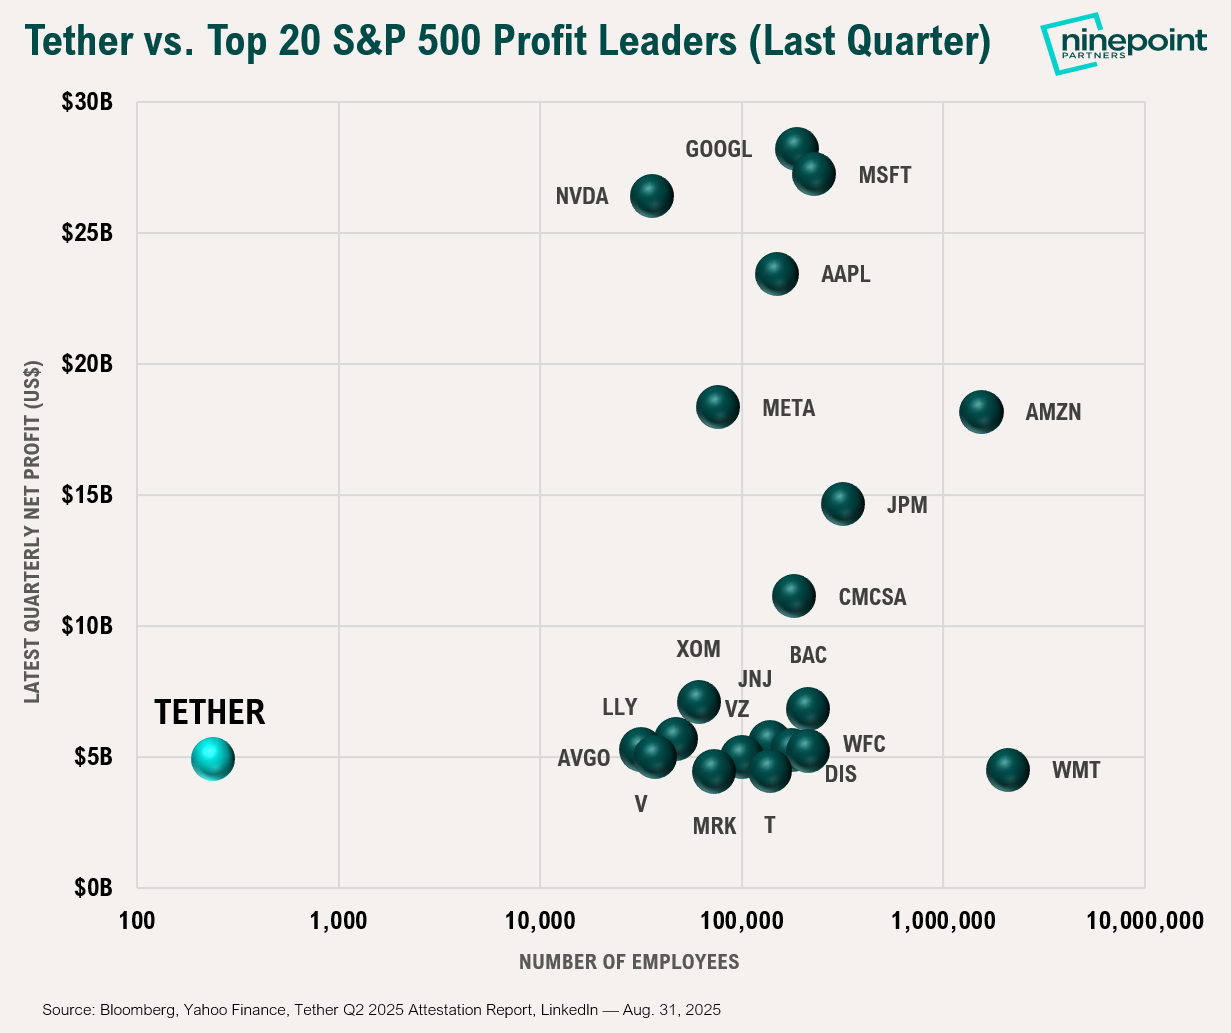
With the latest quarterly earnings season now behind us, we revisit something we touched on last month: Tether’s profitability. Tether, the world’s largest stablecoin issuer with its flagship $170B USDT stablecoin, reported $4.9B in quarterly net profit last quarter. What makes that figure especially remarkable is the company’s scale: Tether is a private company with fewer than 240 full-time employees. If Tether was in the S&P 500, it would have ranked 18th by profit last quarter, outearning the likes of Goldman Sachs ($3.7B), Oracle ($3.4B), and Netflix ($3.1B). Tether’s profit-per-employee is an astonishing $20.5M, one of the highest ever recorded in corporate history. By contrast, Nvidia generates $521K of profit per employee, Apple $156K, and Walmart just $2.1K. Some may classify Tether as an outlier, but perhaps it is the first of a new breed of blockchain-native financial businesses capable of achieving global scale with software rather than manpower. To illustrate the scale of Tether’s profit efficiency, the chart below benchmarks its results against the top 20 profit leaders in the S&P 500, factoring in relative headcounts.
Tether’s $20.5M profit per employee isn’t just impressive—it’s historic. It signals a new era where blockchain-native firms can rival legacy giants with lean teams and software-first scale.
Figure 1: Profit Efficiency Comparison – Tether vs. Top 20 S&P 500 Leaders
On the macro front, this year’s Jackson Hole summit came at a pivotal moment for global markets. Central bankers faced two challenges: defending their independence and steering through an uncertain economic backdrop. Fed Chair Jerome Powell struck a dovish tone, signaling rate cuts could come as soon as September. Markets reacted sharply: the S&P 500 and Nasdaq rose more than 1.5%, while crypto surged even more, sending select cryptoassets like Etheruem and Solana up double digits. But crypto’s biggest moment came not from Powell, but from the Wyoming Blockchain Symposium, its own main event that ran ahead of the central bank meetup.
At the Blockchain Symposium, Fed Vice Chair Michelle Bowman urged regulators to shed an “overly cautious mindset” on crypto, blockchain, and AI; highlighted stablecoins under the GENIUS Act as core to the future of payments; and unveiled a four-pillar framework: certainty, tailored oversight, consumer protection, and competitiveness, including the removal of “reputational risk” from bank exams. SEC Chair Paul Atkins reinforced that shift, doubling down on Project Crypto and confirming the agency’s pivot from enforcement-first to clarity-first regulation. He stressed that most tokens are not inherently securities, saying, “There are very few, in my mind, tokens that are securities, it depends on the package around it and how it’s being sold.” Summing up the mood, Atkins called it “a new day for the crypto industry… we are about innovation. Now we want to embrace innovation.”
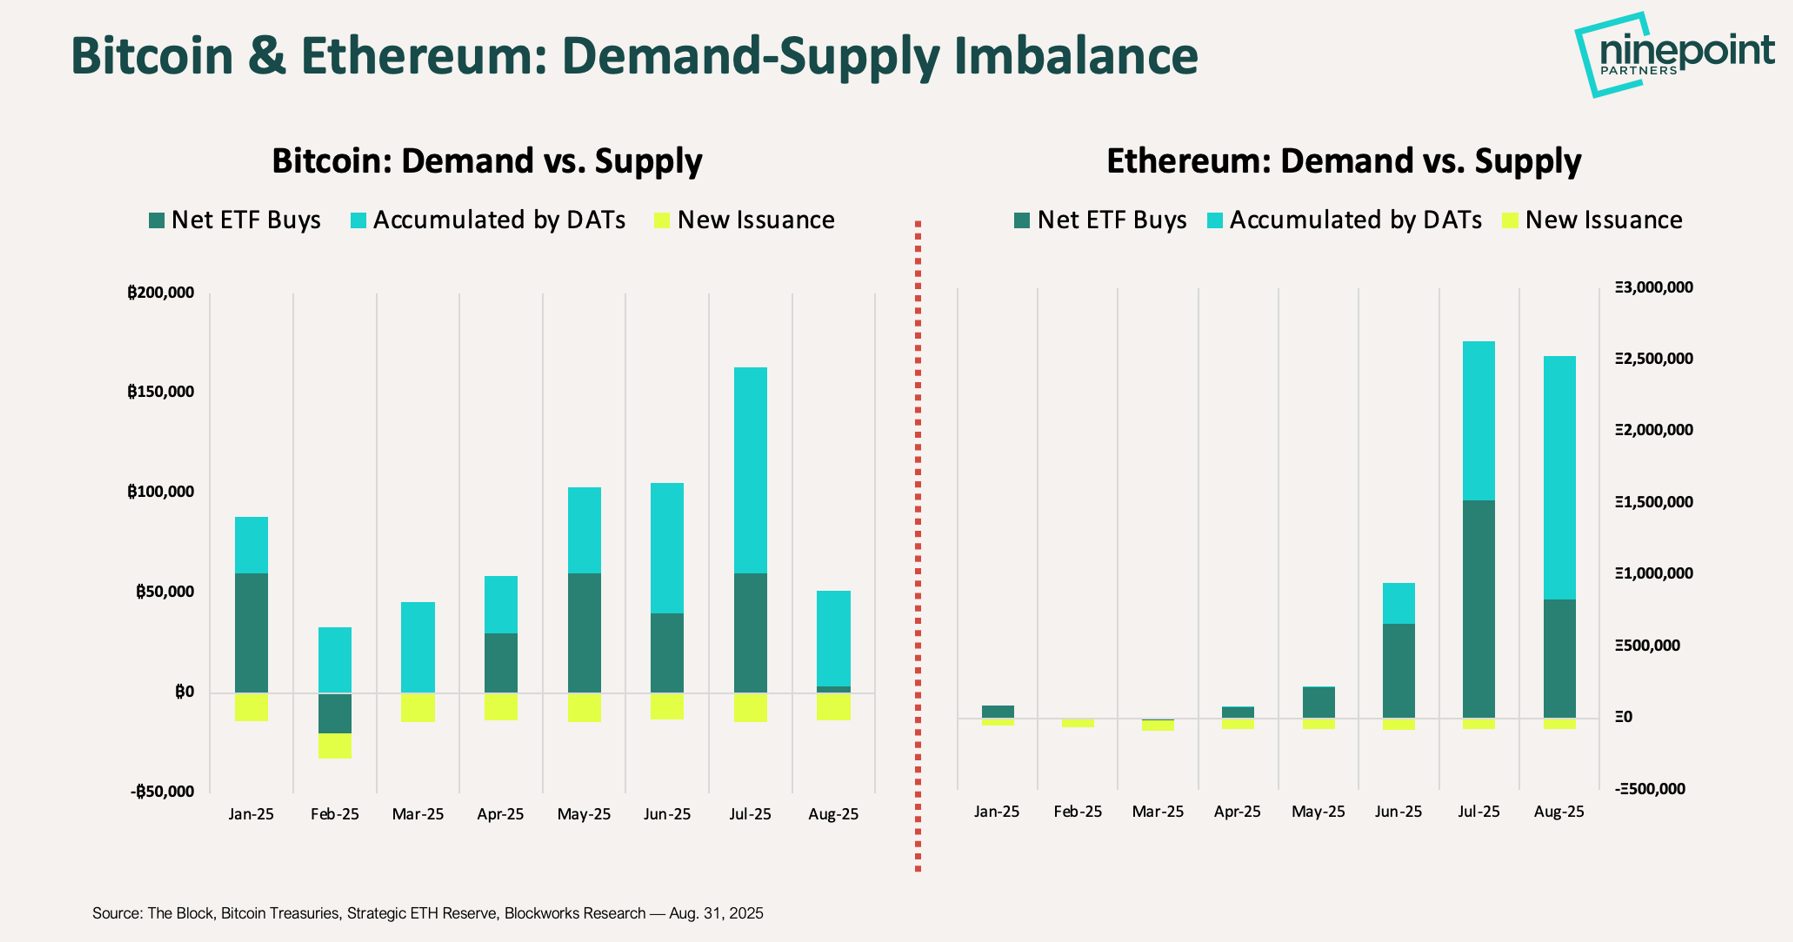
The rapid accumulation of cryptoassets by digital asset treasury (DAT) companies and ETPs has remained one of the strongest forces driving the crypto market higher, particularly for Bitcoin and Ethereum. Since the start of the year, Bitcoin supply has increased by 110K BTC while DATs and ETPs have absorbed 640K BTC. Ethereum’s imbalance is even more extreme: supply has grown by just 560K ETH while DATs and ETPs have acquired 6.5M ETH. Put simply, for every $1 of new supply issued this year, these two cohorts have purchased roughly $6 of Bitcoin and $12 of Ethereum, massive demand-supply dislocations firmly in favor of demand. To capture the scale of this dynamic, we’ve included the chart below highlighting monthly supply versus DAT and ETP buying across Bitcoin and Ethereum.
Figure 2: Demand-Supply Imbalance – DAT and ETP Accumulation vs. New Issuance
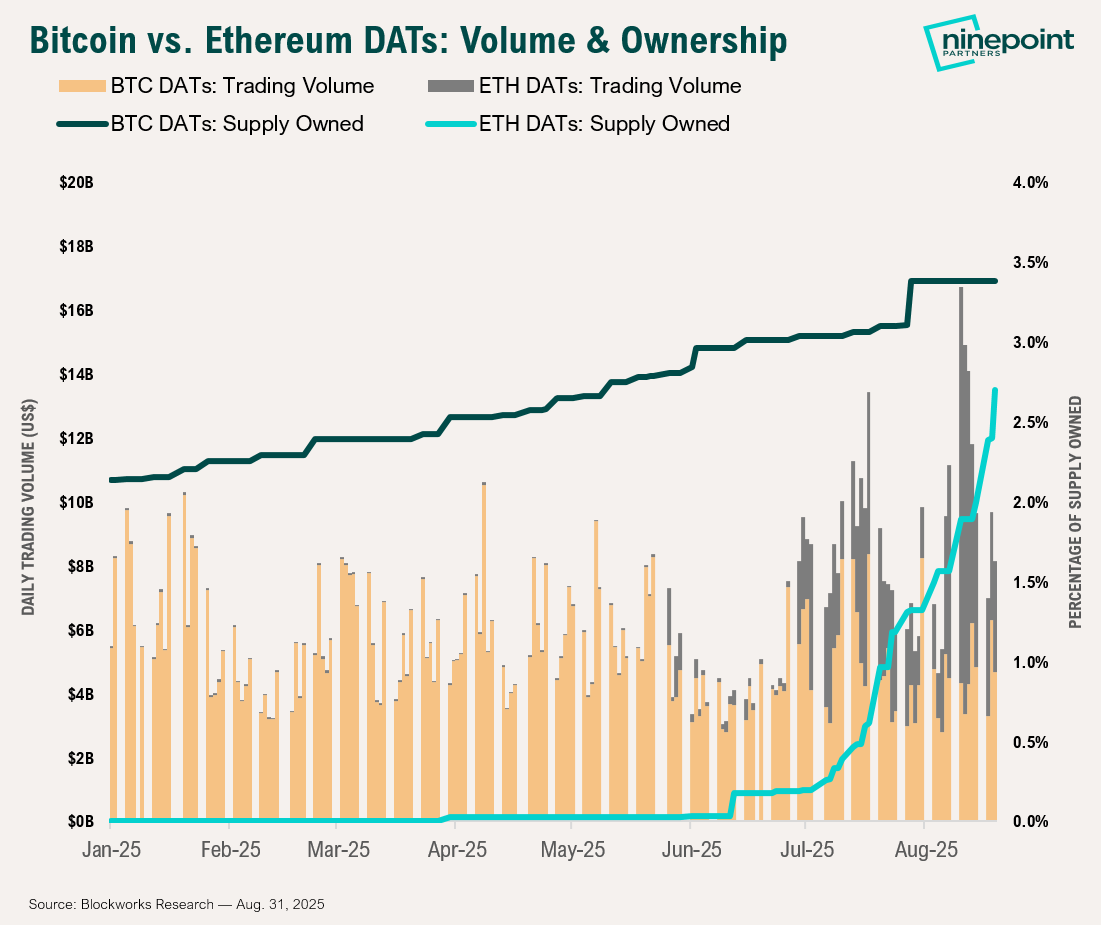
DATs have amassed a total market capitalization of $115B and now hold $95B in cryptoassets, up from just $25B and $13B, respectively, a year ago. They’ve raised over $15B YTD and have showed little signs of slowing down. At the start of 2025, Bitcoin DATs owned 2.1% of the total BTC supply; today, that figure has climbed to 3.4%. In that same timeframe, Ethereum DATs have grown from owning less than 0.1% of ETH supply to 2.7%. While Bitcoin DATs dominated in supply share ownership and trading volumes earlier in the year, Ethereum DATs have forcefully taken the lead since June. If this trend persists, Ethereum DATs are on pace to surpass Bitcoin DATs in overall supply share in the short to medium term. To emphasize this shift, we’ve included the chart below comparing Bitcoin and Ethereum DAT ownership share and trading volumes.
Figure 3: DAT Ownership and Trading Volume – Bitcoin vs. Ethereum DATs
Crypto ETPs continue to see strong investor demand, with global investment products attracting $4.4B of net inflows in August, pushing YTD inflows to $35.5B. These flows, combined with meaningful price appreciation, propelled total AUM across crypto ETPs to a new record high of $244B in mid-August. Bitcoin ETPs have increased their share of total BTC supply from 6.1% at the start of the year to 7.0%, while Ethereum ETPs have nearly doubled their share, climbing from 2.9% to 5.8%. Similar to trends observed in DATs, Ethereum-based products are starting to attract outsized demand: in August alone, Ethereum ETPs saw $4.0B in net inflows, while Bitcoin ETPs experienced a $300M net outflow, marking a real shift in investor preference.
Together, DATs and ETPs have fundamentally reshaped the market structure this cycle, ushering in a mechanical shift where deep pools of institutional capital are increasingly replacing the old retail-driven boom-and-bust dynamics. This transition is building a stronger, more resilient foundation for the crypto market. The asset class is maturing.
Looking beyond Bitcoin and Ethereum, we believe Solana is emerging as the next cryptoasset poised for a major demand shock. There are two main reasons. First, reports in late August pointed to the launch of three large Solana-focused DATs: Sharps Technology with a $400M PIPE, Pantera Capital’s Solana Co. targeting a $1.25B raise, and a consortium led by Galaxy Digital, Multicoin Capital, and Jump seeking to raise $1B. Second, the approval and launch of Solana ETFs in the U.S. may be just months away, with the SEC facing a final decision deadline of October 10, 2025. The precedent set by Ethereum is instructive. The launch of Ethereum DATs acted as the catalyst for a powerful flywheel, driving substantial inflows into Ethereum ETFs and fueling a sustained rally, all at a time when Ethereum sentiment had seemingly been at historic lows. Solana finds itself in a different but related position today. It has cooled off from its historic run, ceded the spotlight to Ethereum, and has been consolidating quietly for months. With large-scale DATs preparing to launch and U.S. ETFs likely on the horizon, the setup is increasingly compelling. If history rhymes, Solana has all the ingredients to be the next major beneficiary of the DAT and ETF wave. Only time will tell, but we hold high conviction that Solana is next in line.
Enterprise adoption continued to accelerate in August. Stablecoin issuer Circle, payment processor Stripe, and tokenization firm Dinari each announced plans to launch their own layer one blockchain networks. Circle is rolling out Arc, a “purpose-built blockchain for stablecoin finance” with USDC as the native gas token. Stripe is preparing to launch Tempo, a “high-performance, payments-focused” blockchain. Dinari is building the Dinari Financial Network, an Avalanche-based blockchain designed to support tokenized real-world assets. Adding to the momentum was Google’s Head of Web3 Rich Widmann, who confirmed that the technology giant is actively building its own layer one blockchain, the Google Cloud Universal Ledger (GCUL).
While details remain sparse, Widmann shared that GCUL is built to support payments and financial applications, featuring Python-based smart contracts to expand accessibility beyond crypto-native developers. While exciting, enterprises building their own blockchains is not new: Coinbase has Base, Kraken has Ink, Sony has Soneium, Robinhood has Robinhood Chain, and Deutsche Bank has DAMA 2. What makes this wave different is that Circle, Stripe, Dinari, and Google are not building Ethereum layer two networks; they are going directly to their own layer ones.
Aside from blockchain launch announcements, enterprises further immersed themselves in tokenization in August. Anthony Scaramucci’s SkyBridge Capital said it is planning to tokenize a portion of two of its hedge funds, the Digital Macro Master Fund and Legion Strategies, equating to $300M on the Avalanche network, about 10% of the firm’s total AUM. Singapore’s largest bank, DBS Bank, unveiled plans to roll out tokenized structured notes on Ethereum to accredited and institutional investors. Japan’s SBI Holdings formed a strategic joint venture with Startale Group to develop a tokenized stock trading platform that supports 24/7 onchain settlement, joining Robinhood, Kraken, and others in pushing tokenized equity products forward.
Looking ahead, we believe Ethereum’s recent rally and outperformance has further room to accelerate and have remained overweight ETH, while also adding to our Solana allocation as it emerges as the next likely beneficiary of favorable demand-supply dynamics. More broadly, the fund is structured to capture the full spectrum of this ecosystem’s growth, from underlying platforms where network activity and adoption continue to expand, to public equities leveraging crypto and AI technologies to transform and strengthen their business models. While September has historically delivered broad market seasonal drawdowns, we remain confident in our positioning and firmly convinced in our thesis, heading into what we believe will be a strong few months to close out 2025.
Alex Tapscott, CFA
Ninepoint Partners