
Commentary




Monthly Update
Year-to-date to September 30, the Ninepoint Global Infrastructure Fund generated a total return of 9.01% compared to the MSCI World Core Infrastructure Index, which generated a total return of 6.62%.
NINEPOINT GLOBAL INFRASTRUCTURE FUND - COMPOUNDED RETURNS¹ AS OF SEPTEMBER 30, 2026 (SERIES F NPP356) | INCEPTION DATE: SEPTEMBER 1, 2011
|
|
1M |
YTD |
3M |
6M |
1YR |
3YR |
5YR |
10YR |
15YR |
INCEPTION |
|
FUND |
-3.56% |
9.01% |
-10.12% |
-3.98% |
5.25% |
14.18% |
9.39% |
8.64% |
8.45% |
8.13% |
|
MSCI World Core Infrastructure NR (CAD) |
-4.66% |
6.62% |
-5.49% |
-2.87% |
5.38% |
14.54% |
8.07% |
7.94% |
10.45% |
10.62% |
After ripping to all-time highs at the end of the second quarter, investors faced three challenging headwinds during the third quarter of 2026. Essentially, rising oil prices and spiking bond yields finally caught up with the equity markets and a momentum-stock correction, driven by concerns related to the AI-build out, hammered some of the biggest year-to-date winners.
To start, crude oil prices were volatile throughout the quarter but continued to move higher on a lack of progress in U.S.-Iran negotiations, occasional attacks on ships in the Strait of Hormuz, damages to pipeline and other infrastructure and widening escalation of the conflict into Yemen and Saudi Arabia. Most notably, sky-rocketing gasoline and diesel prices began hitting consumers at the pumps, heightening inflation fears. In the United States, September CPI increased 0.6% month over month and 3.7% year over year, (with core up 0.3% month over month and up 2.6% year over year), above expectations.
Next, bond investors seemed to lose confidence in the economic outlook (and perhaps the Fed’s ability to rein in persistent inflation using monetary policy) and yields spiked higher. The situation probably wasn’t helped by the US Treasury Secretary’s awkward attempt to intervene by doubling 10 to 30-year bond repurchases that, after talking tough ahead of the announcement, amounted to purchases of only “at least $4 billion” during each operation through the current quarterly refunding period. In fact, bond yields subsequently moved higher, with the US 10-year bond yield hitting 5.36% by early October, a level not seen since the early 2000s.
Finally, concerns regarding the AI-build out triggered a momentum-stock correction in the Communication Services, Industrials, Information Technology and Utilities sectors. Investors suddenly became focused on a myriad of issues, including the ability to finance the buildout (questioning the absolute dollar spend and circular financing), whether return on investment hurdle rates were being met (without much granularity from the hyperscalers), declining token prices (driven by competition from cheaper models) and potentially the oversupply of certain components in the future (including CPUs, GPUs and memory chips).
But as we head into the US midterm elections, thankfully it seems that the markets are stabilizing (and valuations have reset) in anticipation of gridlock. Based on historic precedents, equities tend to find a near-term bottom shortly before election night and have rallied over the following twelve months with a near 100% successful track record. Revenue and earnings have been the most important drivers of year-to-date performance and, according to FactSet, revenue is expected to grow 12.6%, and earnings are expected to grow 29.0%, for Q3 2026. Amazingly, analysts are projecting revenue growth of 12.7% and earnings growth of 32.8%, for the full calendar year.
After the market correction, valuation is less of a concern, with the forward S&P 500 P/E ratio at 19.0x, compared to the 5-year average of 19.8x and the 10-year average of 19.1x. If we consider today’s valuation relative to growth, we still believe that markets are not overly expensive, assuming the estimates hold up through the balance of the year. We therefore view the September/October weakness as normal seasonality and are quite optimistic regarding future equity returns.
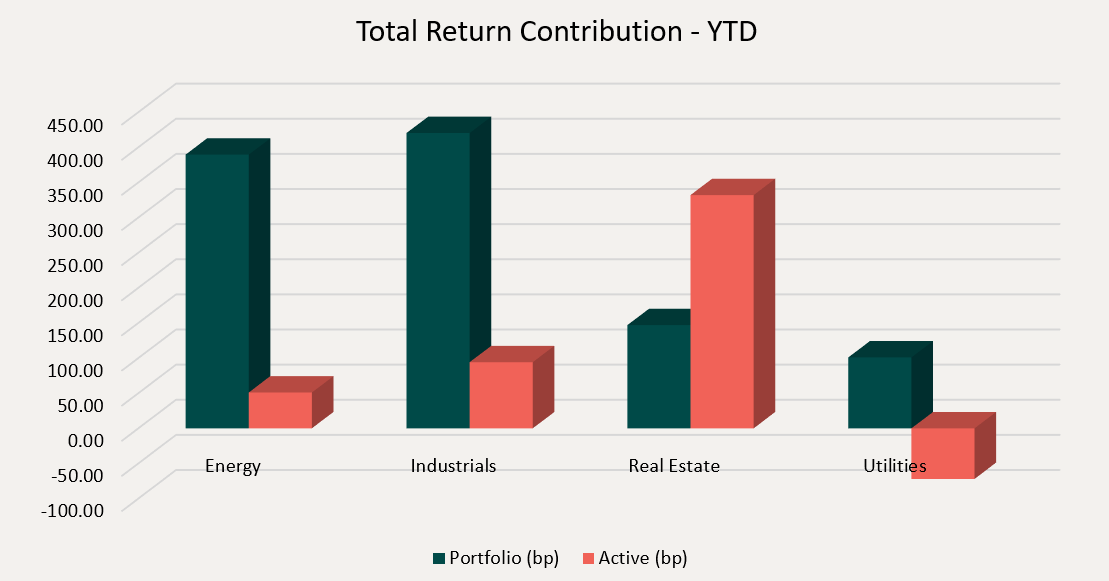
Top contributors to the year-to-date performance of the Ninepoint Global Infrastructure Fund included the Industrials (+420 basis points), Energy (+390 basis points) and Real Estate (+147 basis points) sectors, while no sector detracted from performance on an absolute basis.
On a relative basis, positive return contributions were generated from the Real Estate (+332 basis points), Industrials (+94 basis points) and Energy (+51 basis points) sectors while only the Utilities (-72 basis points) sector generated a negative return contribution.
Click for larger image
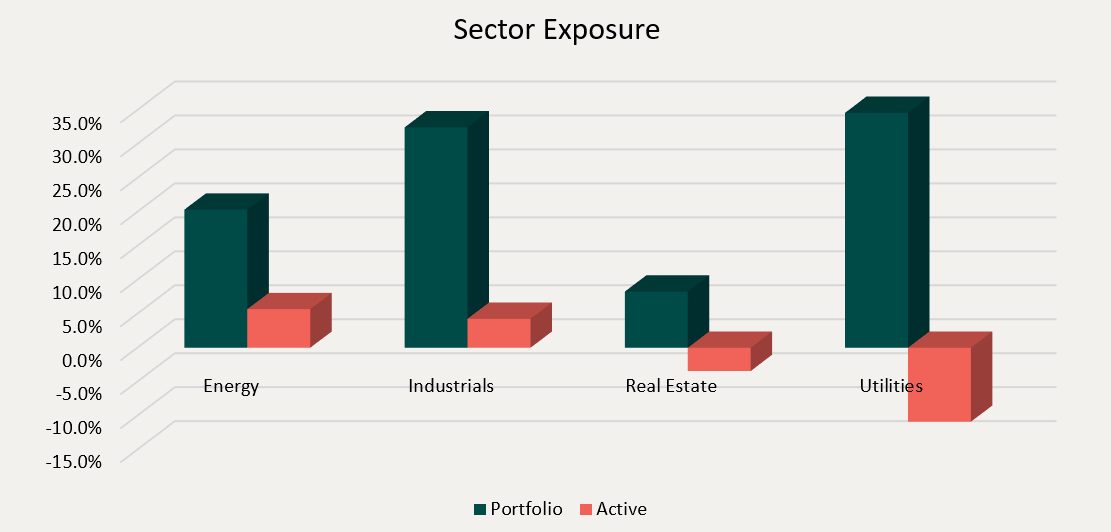
We are currently overweight the Energy and Industrials sectors and underweight the Utilities and Real Estate sectors. Despite the concerning global geopolitical events leading to a spike in oil prices & interest rates and the impending US midterm elections, the broad equity markets have been remarkedly resilient. Importantly, the key driver of the equity markets this year has been solid earnings growth, led by the AI-build out theme but now broadening across sectors. We remain focused on high quality, dividend paying infrastructure equities that have demonstrated the ability to consistently generate revenue, cash flow and earnings growth through the business cycle.
We continue to believe that the infrastructure asset class is well positioned to benefit from the ongoing electrification of the global economy and the growing emphasis on sovereign control of critical infrastructure. Renewed investment in infrastructure that supports a secure and reliable domestic energy supply is expected to drive attractive long-term opportunities. As a result, we are comfortable maintaining exposure across a range of infrastructure sub-sectors poised to benefit from these themes, including traditional energy assets (such as storage and pipelines), electrical utilities (with an emphasis on those using natural gas or nuclear feedstocks), and engineering & construction contractors.
Click for larger image
The Ninepoint Global Infrastructure Fund was concentrated in 30 positions as at September 30, 2026, with the top 10 holdings accounting for approximately 39.0% of the fund. Over the prior fiscal year, 27 out of our 30 holdings have announced a dividend increase, with an average hike of 9.0% (median hike of 6.7%). Using a total infrastructure approach, we will continue to apply a disciplined investment process, balancing valuation, growth, and yield in an effort to generate solid risk-adjusted returns.
Jeffrey Sayer, CFA
Ninepoint Partners