 July 31, 2025
Commentary


The monthly commentary discusses recent developments across the Ninepoint Diversified Bond, Ninepoint Alternative Credit Opportunities and Ninepoint Credit Income Opportunities Funds.
Macro
We saw some fireworks at the end of July. First off, we had the first estimate of Q2 GDP growth in the U.S., which bounced back to 3% from a depressed -0.5% in Q1. However, the GDP figures for the first half were heavily distorted. The trade war had caused firms to front load imports in Q1, building up inventories, and in Q2 we saw the exact opposite- imports dropped, and inventories were drawn down. To gain a better sense of the underlying health of the economy, it is preferable to look through the headline numbers and focus on the three main drivers of growth: consumption, housing and business investment. Economists call this “Final Private Domestic Demand”, shown in Figure 1 below. Chair Powell himself often cited this measure as a better indicator of the direction of the economy, think of it a bit like “Core GDP”.
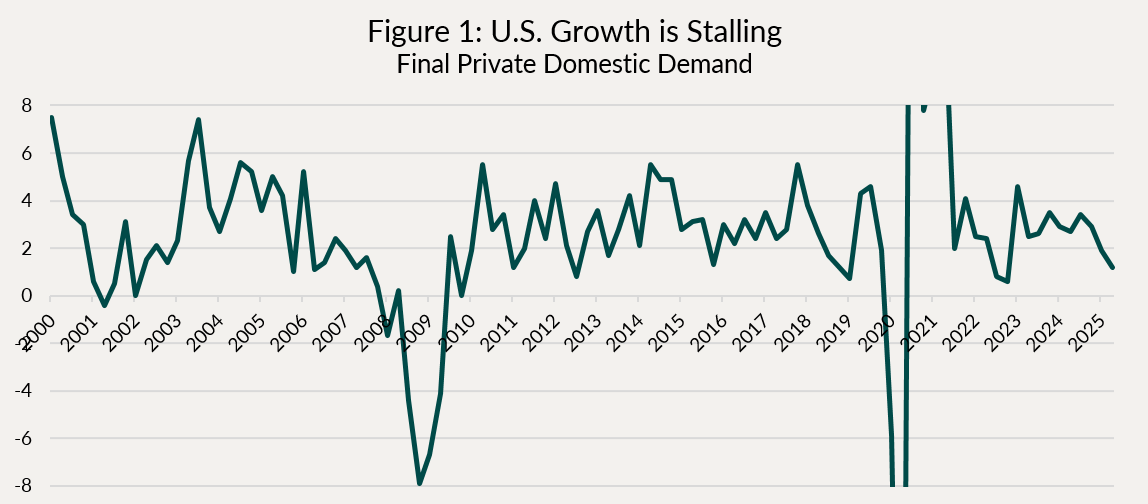
Housing investment has been slow (negative contributor to GDP for 4 of the past 5 quarters) due to affordability issues, while business investment has remained robust. Overall, investment makes up just under 20% of U.S. GDP.
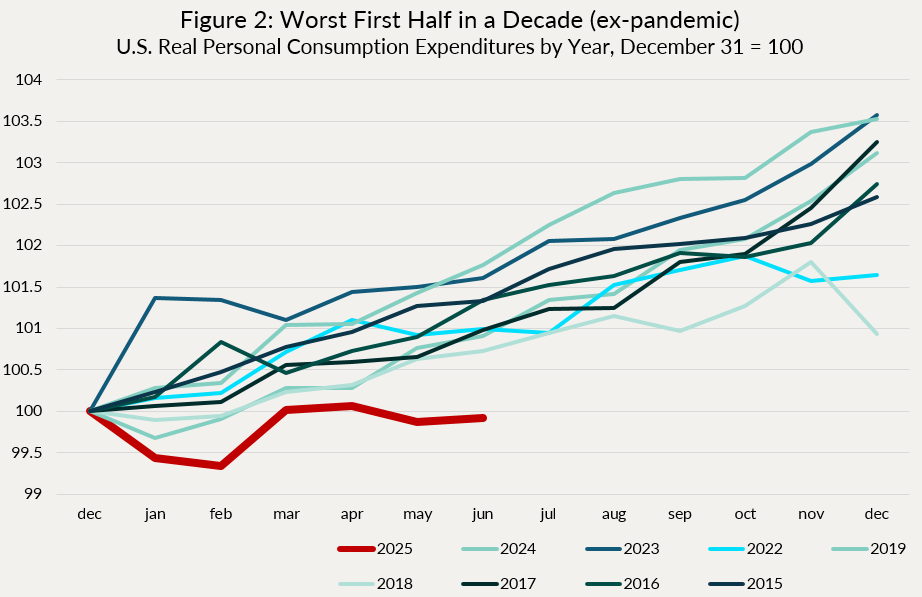
The biggest component of GDP, by far, is household consumption, at just under 70%. Up until recently, the strength of the U.S. consumer had everyone (us included) scratching their heads. Not anymore. Figure 2 below shows the monthly pace of U.S. personal consumption in real terms, rebased to 100 at the start of each of the last 10 years (excluding the pandemic). In a “normal” year, personal consumption grows between 1.5-3.5%. We find it pretty striking that, year to date, the pace of consumption is mildly negative, making it, by far, the worst first half in a decade.
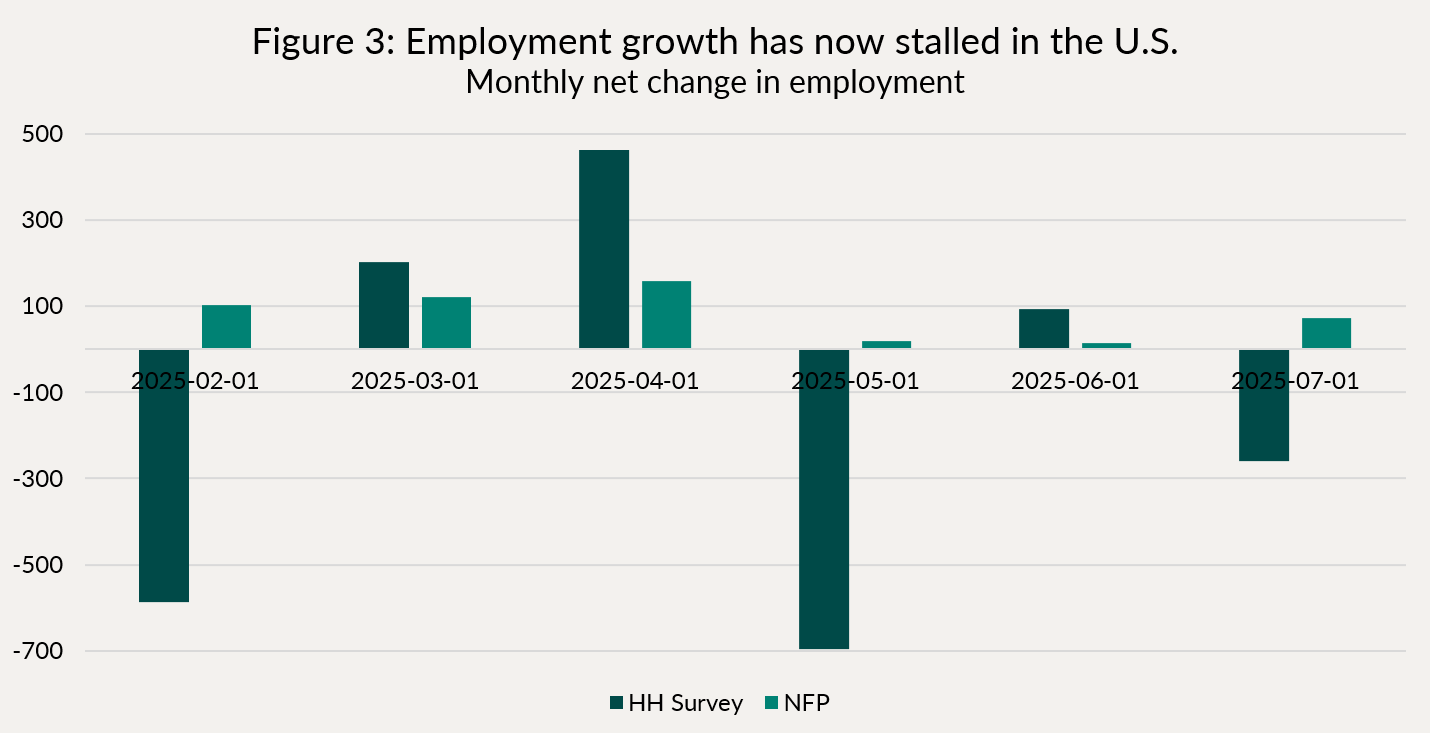
Finally, the labour market, which is typically the most lagging economic indicator, is also showing signs of strain. Figure 3 below shows the monthly change in employment according to the household survey, and non-farm payrolls (NFP). The most recent revisions to the NFP essentially wiped out the past 2 month’s gains, and saw the unemployment rate climb back to last summer’s highs of 4.25%. NFP is a heavily smoothed statistic, which incorporates many assumptions that later get revised. Historically, negative revisions of this magnitude are rarely seen outside of recessions.
Adding to the weight of this employment report, two days earlier, at the FOMC meeting, Chair Powell emphasized several times that the committee was increasingly attentive to downside risks to the labour market. Therefore, the labour market is once again taking center stage in monetary policy deliberations. The Fed will see another employment report before their next meeting in September, and if this trend continues, we expect the bond market to push hard for a restart of the rate cut cycle. Already, at the time of writing, a 25 basis points cut is 91% priced-in by markets, with a total of 58 basis points by year-end. A weak employment report for August would likely lead the market to push for a 50 basis points cut in September. We have been and remain positioned to benefit from further rate cuts in the U.S..
Here in Canada, the situation is more stable, albeit from an already weak position. The Bank of Canada (BoC) has now been on hold for three consecutive meetings, but is keeping the door open to further cuts, should the economy deteriorate further, and inflation moderate.
On the topic of Canadian inflation, yes core has moved up to around 3% lately, reflecting higher prices on automobiles, some food and imported goods. The weak Canadian dollar earlier this year was also partly to blame, although that has normalized somewhat. But, in the BoC’s press release, they specifically singled out shelter inflation as remaining elevated.
Perhaps, but for how long?
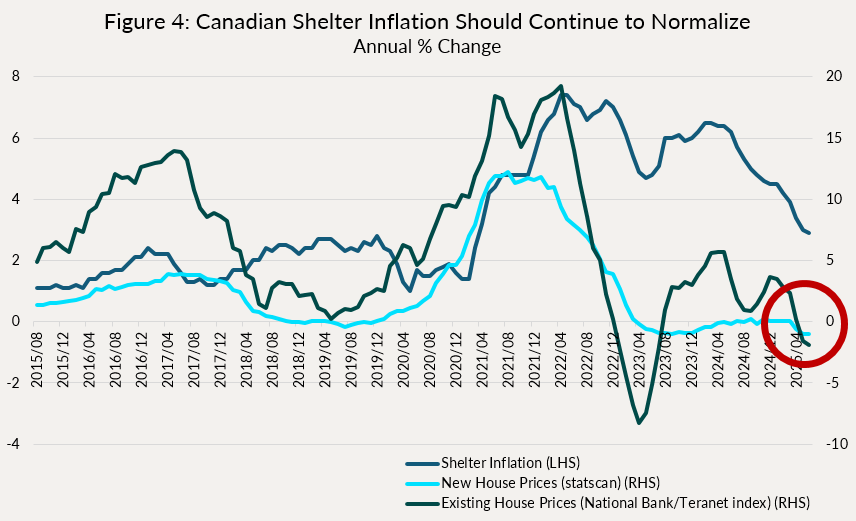
Figure 4 below shows shelter inflation, which has dropped meaningfully and is now only 2.9% y/y, along with new and existing home price growth (y/y). With house prices now declining, and anecdotally, rents also declining year-over-year, it seems highly likely that shelter inflation will continue to decelerate for the foreseeable future. In other words, there’s a lot of disinflation that is already baked into the future, as house prices and rents make their way into CPI with a lag. So why would the BoC clearly call out shelter inflation as elevated as a reason to keep rates on hold?
It seems to us that they might be buying time, waiting to see how the trade negotiations with the U.S. will get resolved. With the unemployment rate at almost 7%, and growth softening south of the border, it feels like it is a matter of when, as opposed to if, we see further rate cuts by the BoC. For now, the market seems to be buying into this, with not even a full rate cut priced-in by the end of the year. That, we think, is probably too little.
On the credit front, there’s not much to report on. Credit spreads remain close to post-GFC tights. We are recycling maturities in select ABS new issues, coming at attractive levels relative to corporates.
Individual Fund Discussion
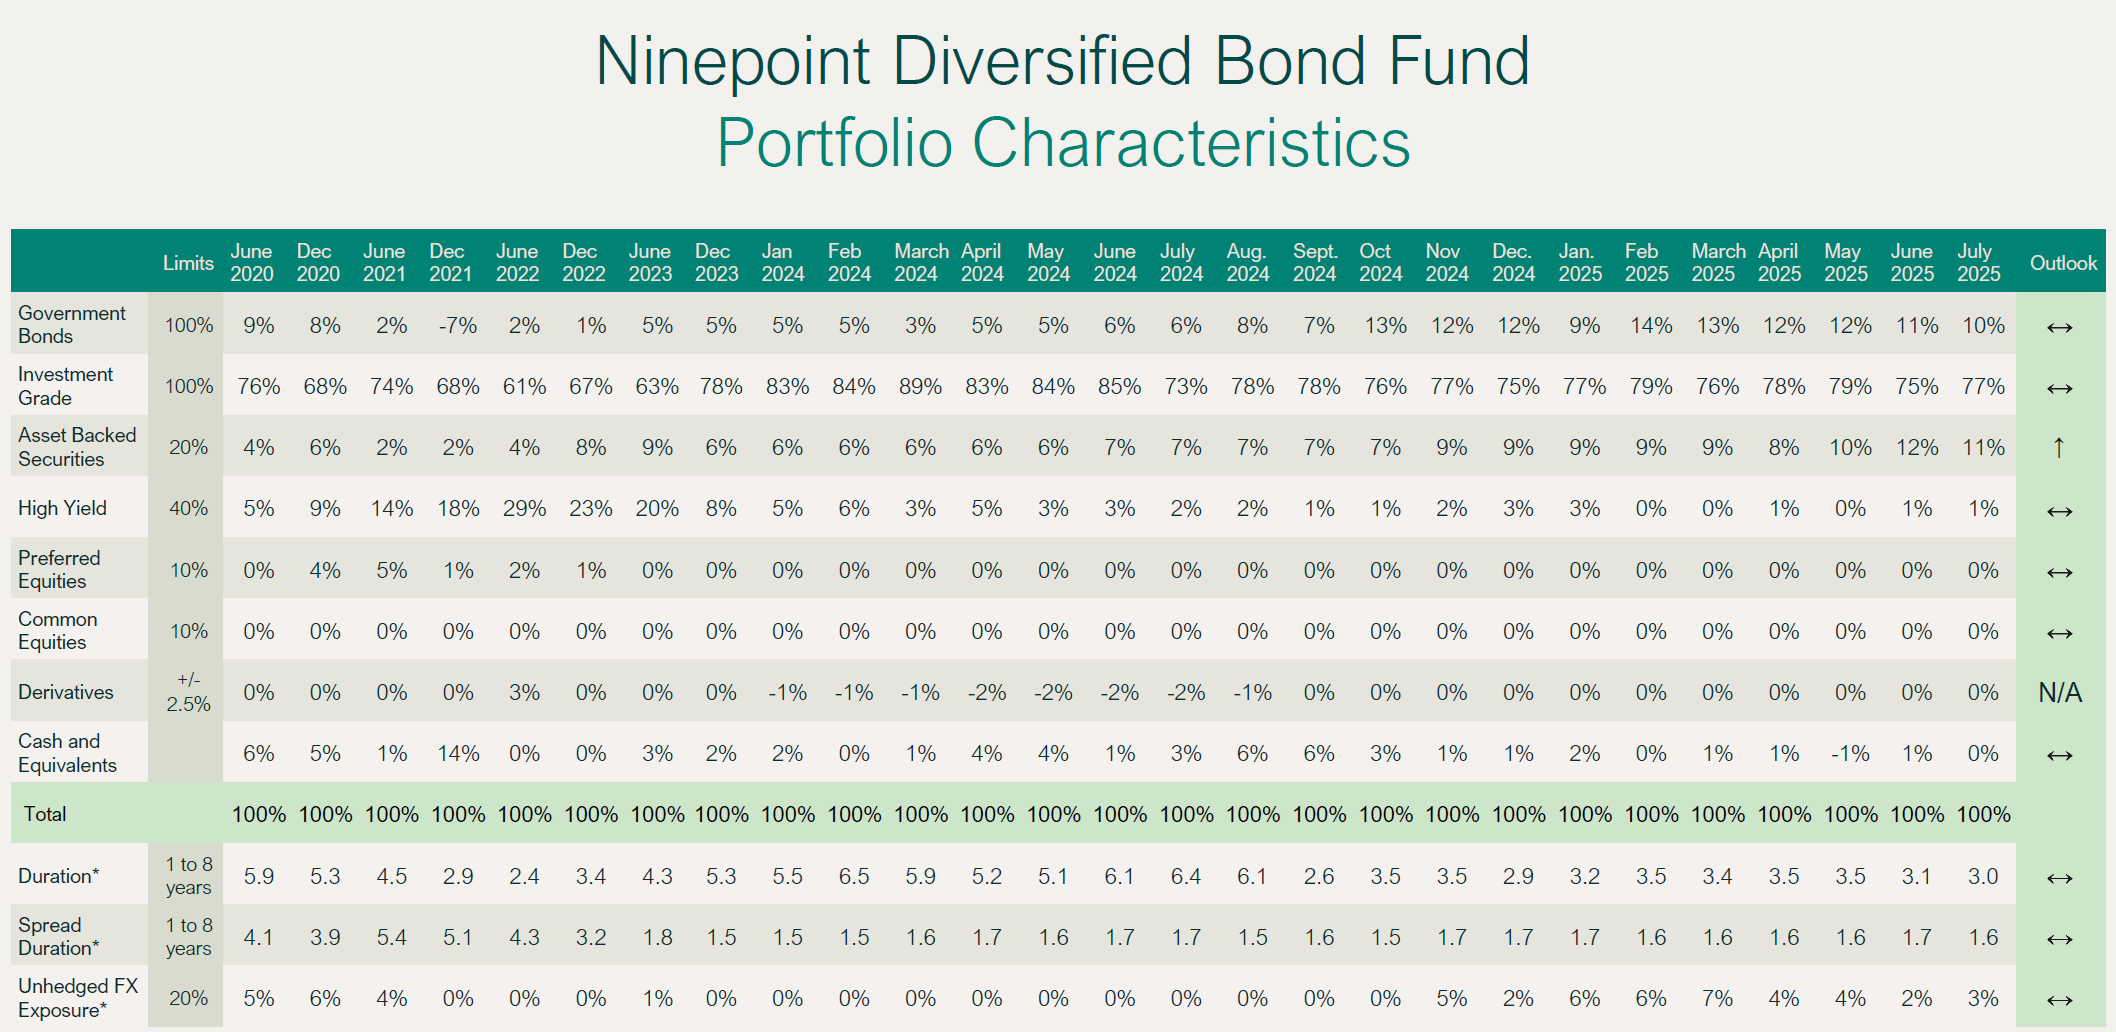
Ninepoint Diversified Bond Fund
July was a good month for the fund, returning +18 basis points (vs -70 basis points for the Canadian index), taking our YTD total to 2.26% net of fees (F-class). Duration remains stable, at 3 years, of which about 30% comes from the U.S. rates market, where we see the potential for more rate cuts. The yield to maturity remains stable at 4.5%.
NINEPOINT DIVERSIFIED BOND FUND - COMPOUNDED RETURNS¹ AS OF JULY 31, 2025 (SERIES F NPP118) | INCEPTION DATE: AUGUST 5, 2010
1M |
YTD |
3M |
6M |
1YR |
3YR |
5YR |
10YR |
Inception |
|
|---|---|---|---|---|---|---|---|---|---|
Fund |
0.18% |
2.26% |
0.51% |
1.18% |
6.24% |
4.45% |
1.24% |
2.52% |
3.54% |
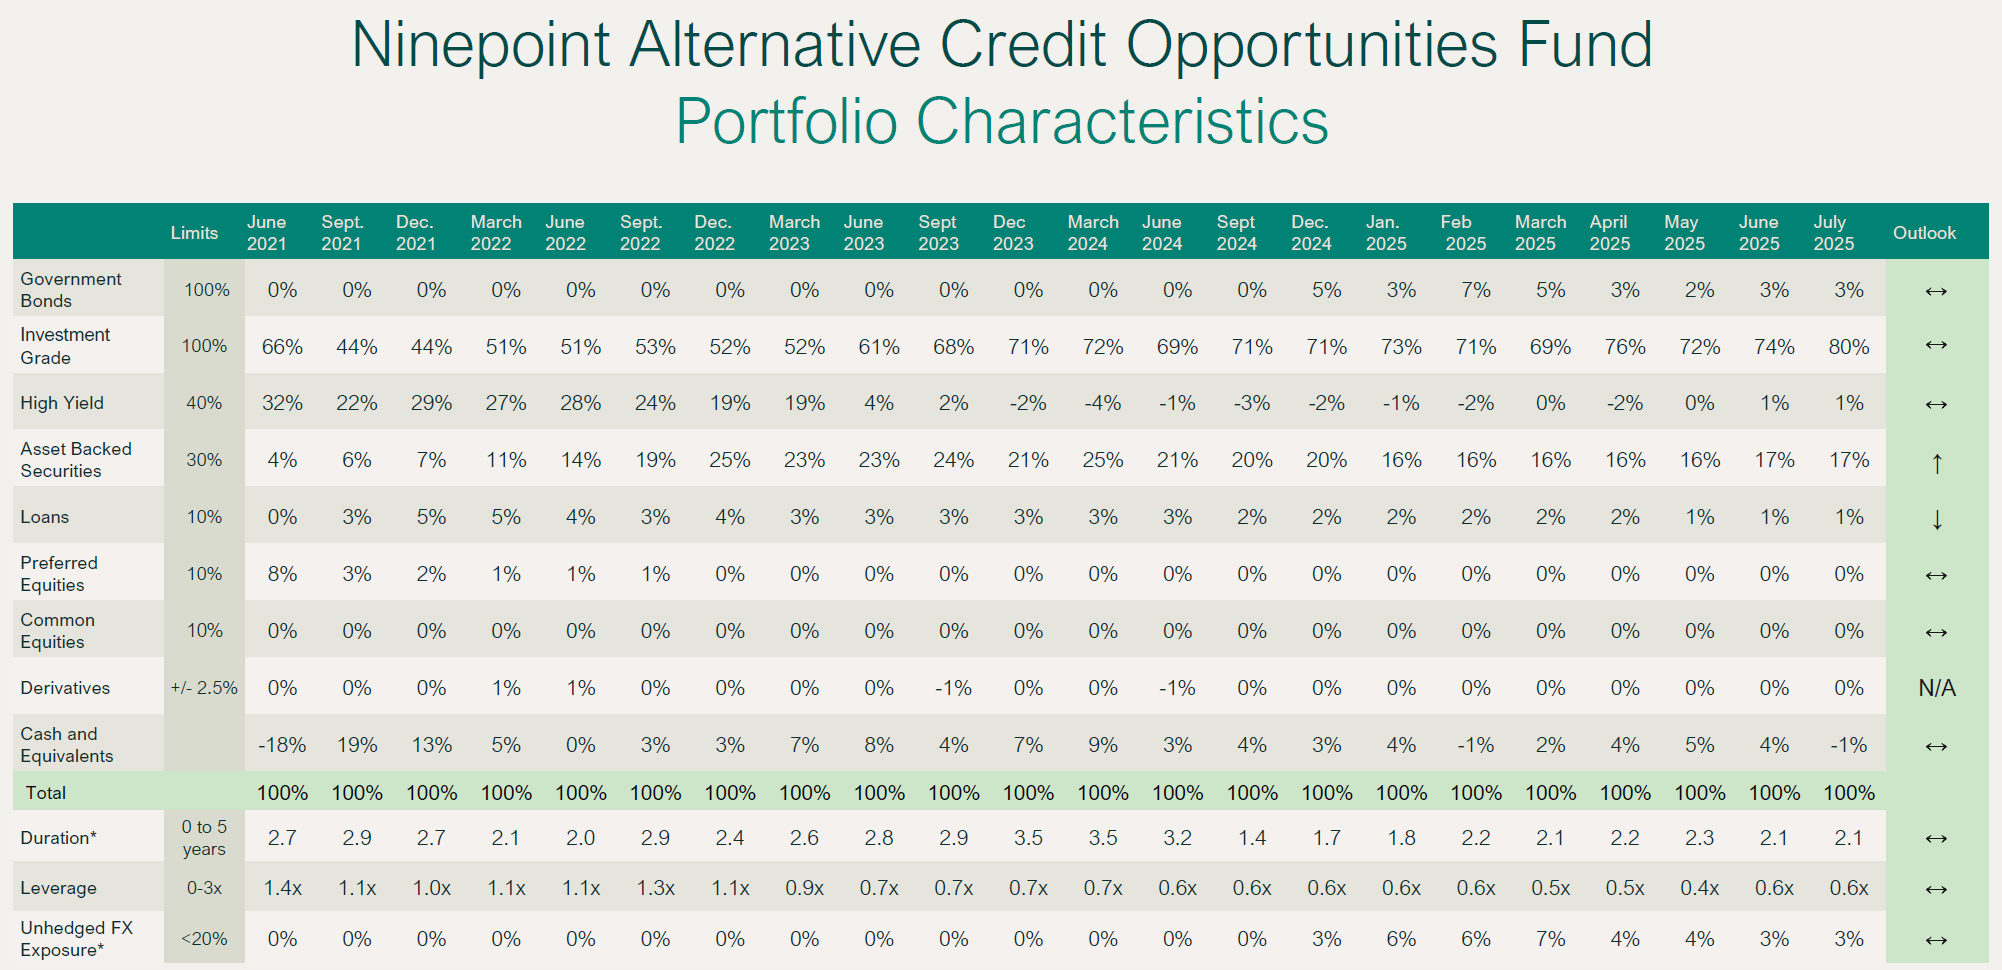
Ninepoint Alternative Credit Opportunities Fund
July was a solid month for our credit strategy, returning 52 basis points. Credit spreads remain tight, so we have left our leverage more or less unchanged (0.6x). At month-end, the fund had a yield-to-maturity of 5%, credit duration of 3.0 years, and overall duration of 2.1 years. We made very few changes intra-month.
NINEPOINT ALTERNATIVE CREDIT OPPORTUNITIES FUND - COMPOUNDED RETURNS¹ AS OF JULY 31, 2025 (SERIES F NPP931) | INCEPTION DATE: APRIL 30, 2021
1M |
YTD |
3M |
6M |
1YR |
3YR |
Inception |
|
|---|---|---|---|---|---|---|---|
Fund |
0.52% |
2.20% |
1.20% |
1.43% |
6.02% |
6.03% |
2.66% |
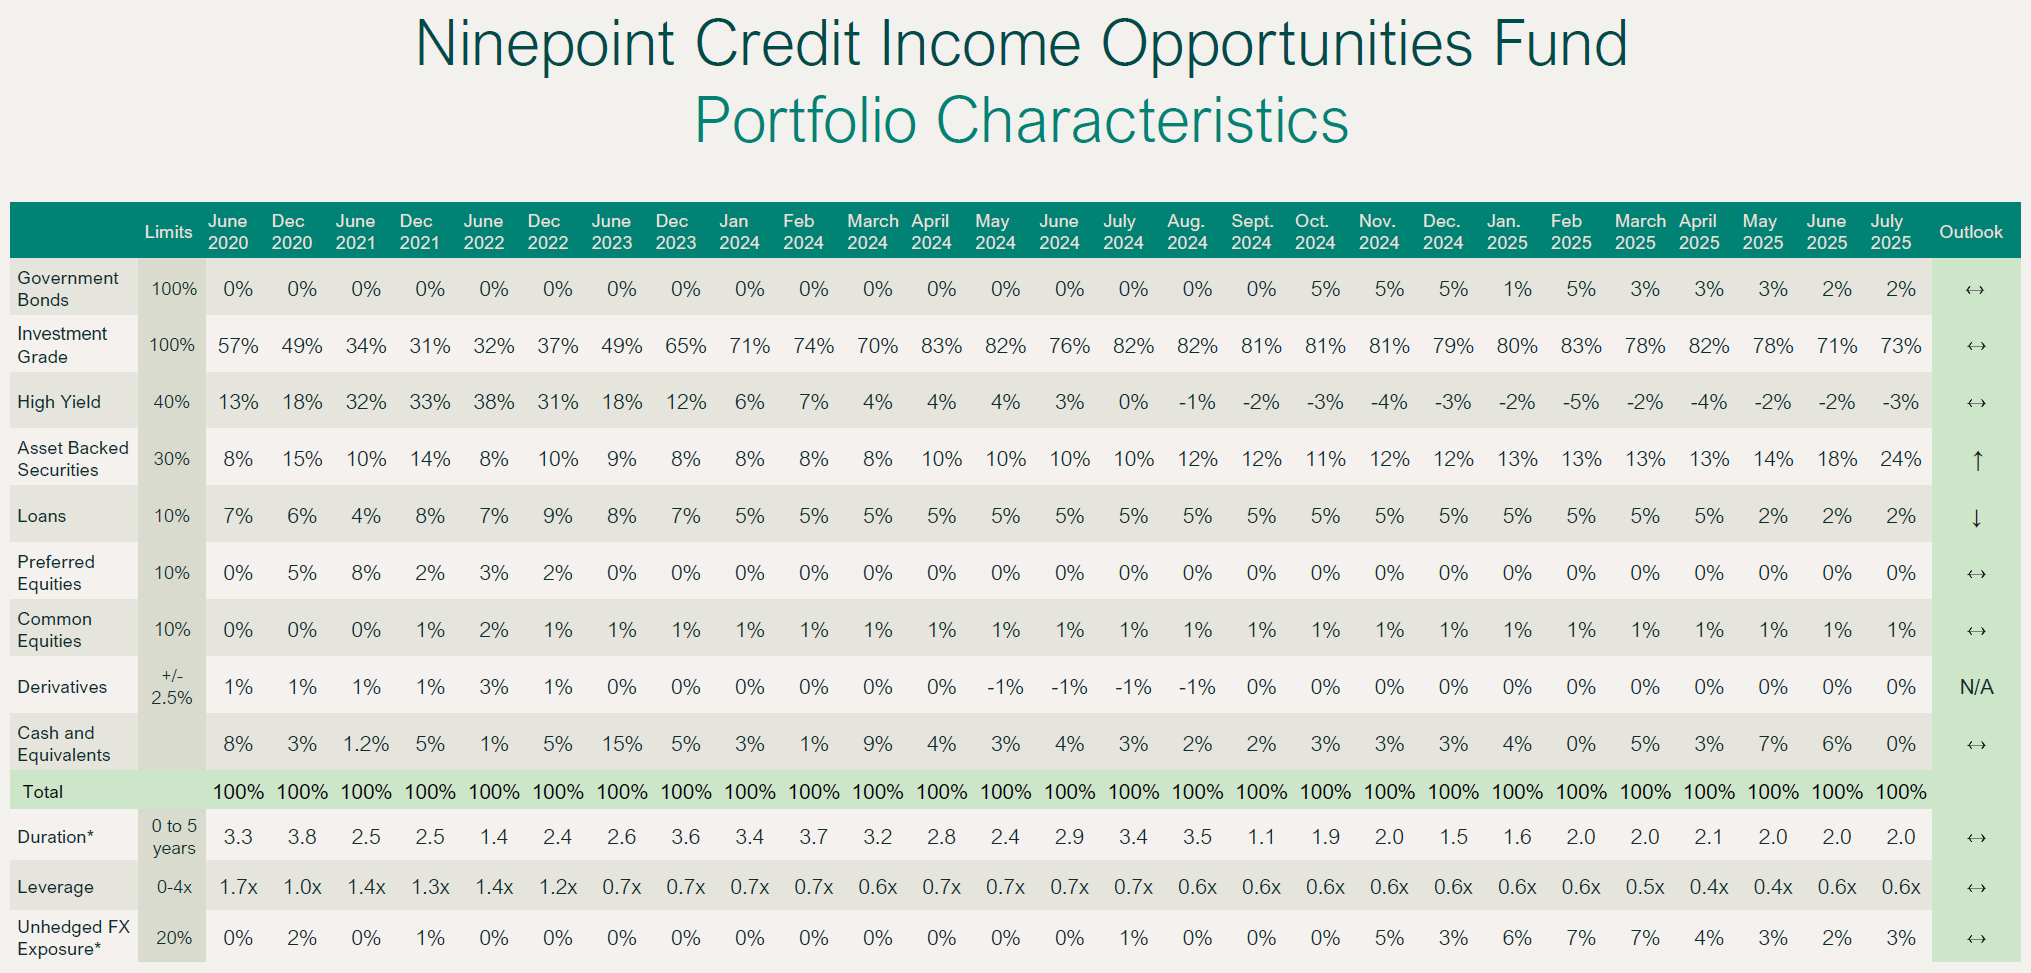
Ninepoint Credit Income Opportunities Fund
Other than returning 0.39% vs 0.52% (and 2.15% vs 2.20% YTD) for the Ninepoint Alternative Credit Opportunities fund, the discussion for the Credit Income Opportunities fund is essentially the same, so we would refer readers to the previous section. These two funds are managed to basically the same strategy.
NINEPOINT CREDIT INCOME OPPORTUNITIES FUND - COMPOUNDED RETURNS¹ AS OF JULY 31, 2025 (SERIES F NPP507) | INCEPTION DATE: JULY 1, 2015
1M |
YTD |
3M |
6M |
1YR |
3YR |
5YR |
10YR |
Inception |
|
|---|---|---|---|---|---|---|---|---|---|
Fund |
0.39% |
2.15% |
0.92% |
1.31% |
5.79% |
6.41% |
5.16% |
4.92% |
4.92% |
Conclusion
The policies and actions taken by the U.S. administration are starting to affect the U.S economy. July could be an inflection point for the Fed and markets. We’ll try and enjoy the balance of the summer while we stay tuned for the next employment report!
Until next month,
Mark, Etienne & Nick
As always, please feel free to reach out to your product specialist if you have any questions.