
Commentary




The monthly commentary discusses recent developments across the Ninepoint Diversified Bond, Ninepoint Alternative Credit Opportunities and Ninepoint Credit Income Opportunities Funds.
A September to Remember
September saw a massive sell-off in rates globally, and particularly in the U.S., where 10 and 30-year rates hit multi-decade highs (the sell-off continues, and they went as high as 5.36% and 5.73% at the time of writing). The Fed was the latest major central bank to throw in the towel and restart the hike cycle, hiking 25 basis points in a unanimous decision and suggesting more is to come. The song remains the same: elevated energy prices are forcing central banks to hike rates, while profligate governments coupled with AI infrastructure spending is resulting in a seemingly insatiable borrowing need. The higher rates go, the more unsustainable the fiscal situation becomes.
Table 1 below shows the current fiscal situation across the G7, according to the IMF’s latest Fiscal Monitor, which dates back to April. Of course, interest rates have gone up meaningfully since then, so those figures are overly flattering. Nonetheless, it is clear from this table that some countries are on unsustainable debt paths (U.S., UK, France, Italy and Japan), while others have better fundamentals (Canada, Germany). Unsurprisingly, those countries with better debt and deficit dynamics are the ones that have also seen lower increases in borrowing costs (last column of Table 1).

As we have argued all year, while all the countries above have faced a similar set of shocks this year, the starting point matters a lot, both for the monetary policy and markets response.
In the U.S., policy and institutional uncertainty due to the many drastic changes imposed by the current administration, coupled with the highest deficit across the G7 and core inflation that has remained well above the FOMC’s 2% target for 5 years, was met with a very large repricing of both monetary policy expectations and of the term premium, sending the yield curve much higher and flatter (Table 2 below shows the monthly and year-to-date changes in U.S. benchmark rates).

Click for larger image
In Europe, fiscal issues in the UK, France and Italy, along with a heavy reliance on energy from the Persian Gulf, have forced the ECB to hike twice already, while government bond yields have also sold off materially around erratic policy (constant change of government, mixed signals on fiscal policy, failure to pass budgets, etc.).
Japan has its own set of problems. They are a large energy importer, carry the highest debt load in the G7 (on a gross and net basis) and elected a new government that wants to spend more, just when inflation is finally moving higher. The Bank of Japan has been slow to tighten policy, resulting in large increases in long-term bond yields, which are at their highest level since the 1990s.
Canada and Germany have much better fiscal profiles than the rest of the G7 and have therefore seen much shallower selloffs in their long-term benchmark yields, despite being both hit by the energy shock. This is where the comparison ends though. Canada, being a net energy exporter, is in a much better posture to weather this shock. The trade war with the U.S. is certainly hurting more here, resulting in more slack in the economy. Add to this a weak housing market that is recovering from a decade-long boom, and you have several elements contributing to low and steady core inflation. Indeed, core inflation in Canada has been at or around target for several quarters now, affording the Bank of Canada more time to assess the situation.
Unfortunately for Canadian bond investors, global interest rates are highly correlated, not only because they face the same shocks, but also because we all share, to some extent, the same investor base and compete for the same pools of savings. So when French bonds sell off due to their inability to pass a budget, we see contagion across the world. When Treasury Secretary Bessent’s expanded buybacks failed to hold down long-term U.S. yields, which went on to new highs, other fixed income markets followed.
This is particularly true for long-term rates, where factors like inflation risk premium and confidence play a bigger role, whereas 2-year or 5-year bonds are highly sensitive to domestic monetary policy decisions and expectations. This is one of the main reasons why we usually prefer to buy short to intermediate maturity bonds. It can be quite challenging to evaluate the dynamics of global bond market conditions that drive 10 and 30-year rates, we find it more manageable to assess what central banks are likely to do, given economic conditions.
After sounding surprisingly hawkish at their September meeting, Governor Macklem has soften his rhetoric and with that, we have seen the odds of a rate hike at the October meeting come down drastically (from over 70% to about 35% at the time of writing). Such high odds of an October rate hike never made much sense to us, as core inflation remains well contained at 2% and the breadth of inflation not accelerating (see last month’s commentary for details on our estimates). Nonetheless, the bond market still has about 100 basis points of rate hikes priced-in for Canada over the next 12-months. That would be significant tightening for an economy that’s operating with some slack, where core inflation is right at target, and whose housing market (shelter is ~30% of the CPI basket and growing at only 1.5% y/y) is still in the doldrums.

Click for larger image
Given all the above, we see the current selloff as an attractive buying opportunity for Canadian bond investors. But careful what you buy and stick to what monetary policy controls (front-end) and avoid the pitfalls of global bond markets with 10 and 30-year bonds. The fiscal situation in several G7 countries is untenable, their governments are weak (minorities, lack of consensus, etc.) or want to spend even more, leading to bond vigilantes being increasingly on edge.
Credit Markets
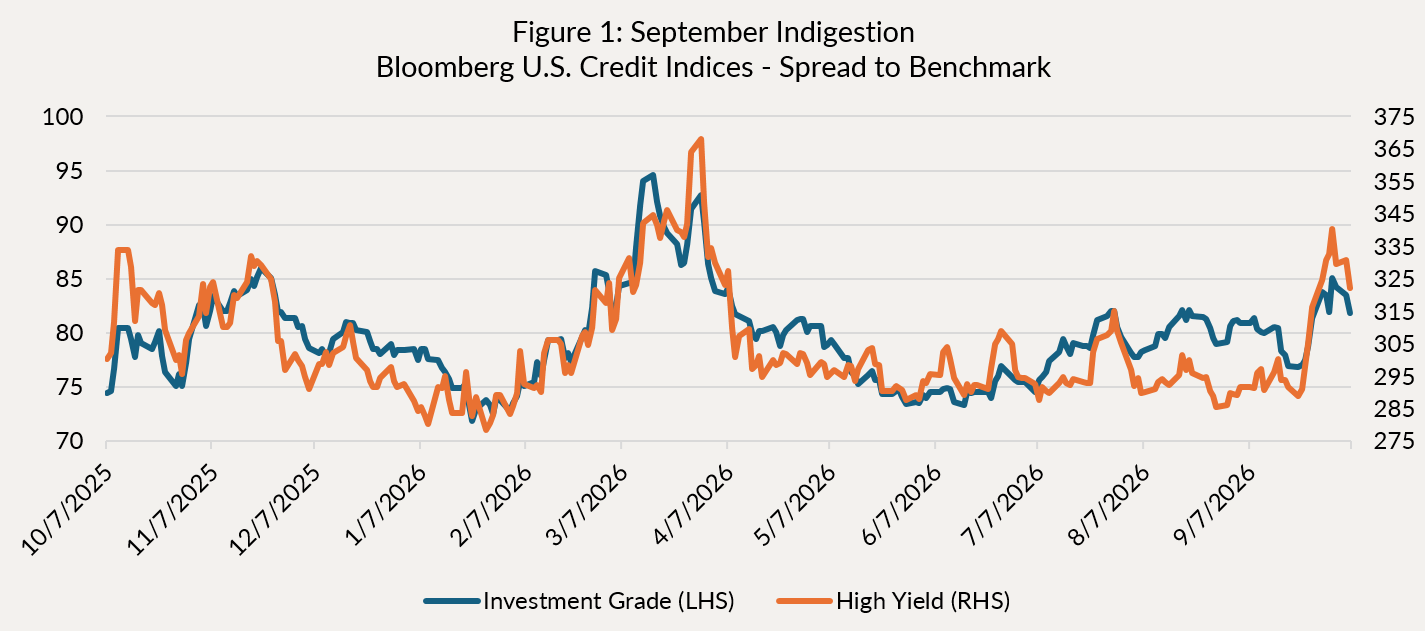
As expected, September was a busy month in credit markets. New issues were plentiful, but did not overwhelm, at least in investment grade markets. High Yield was a different story, where a few mega deals such as SoftBank and Paramount performed poorly and pushed the whole complex wider (Figure 1 below). The U.S. IG market remains at the mercy of hyperscaler supply, which for now has quieted down, but given their spending plans, it is only a matter of time before we see more issuance from them, which should keep pushing related companies’ spreads wider.
Click for larger image
As discussed in the past, we have been avoiding this space, not that Google or Amazon are fundamentally bad credits, but since their borrowing needs are so vast, so from a technical standpoint, they keep pushing the relative value of their bonds down. Not exactly the kind of investment we are after…
Instead, we have been focused on adding corporate bonds in the 5-year and shorter space. For example, Vital Infrastructure, a turnaround REIT that is really making serious progress cleaning up their balance sheet, priced a new 3-year bond with a 4.865% coupon. We also took advantage of steeper front-end rates, extending part of our Enbridge Hybrid position, from the September 2027 to the October 2031 (call dates), picking over 1% more yield (4.25% vs 5.28%).
Post month-end, we also bought Eagle Credit Card Trust, President’s Choice Bank’s funding vehicle. Given the good historical performance of this program and the exceptional amount of excess spread in the structure, we are comfortable owning the junior tranches in this credit card ABS. They issued 3 and 5-year tenors, with yields, depending on the tranche, ranging from 4.787% to 6.409%. That’s attractive!
The fiscal issues in France are also starting to have impacts on credit markets. The spread between French government bonds (OATs) and Germany (Bunds) is at levels last seen during the Eurozone debt crisis of 2010-2011. It is starting to spread to European credit, mostly French and Italian banks. For now, we haven’t seen much contagion in North America (other than French bank bonds issued in $USD or $C), but should things become uglier there, we could see more fireworks. We have very minimal exposure to French banks across the funds.
With CDX still at very tight levels, we continue to roll hedges, where we sell call spreads to buy put spreads for zero cost.
Funds
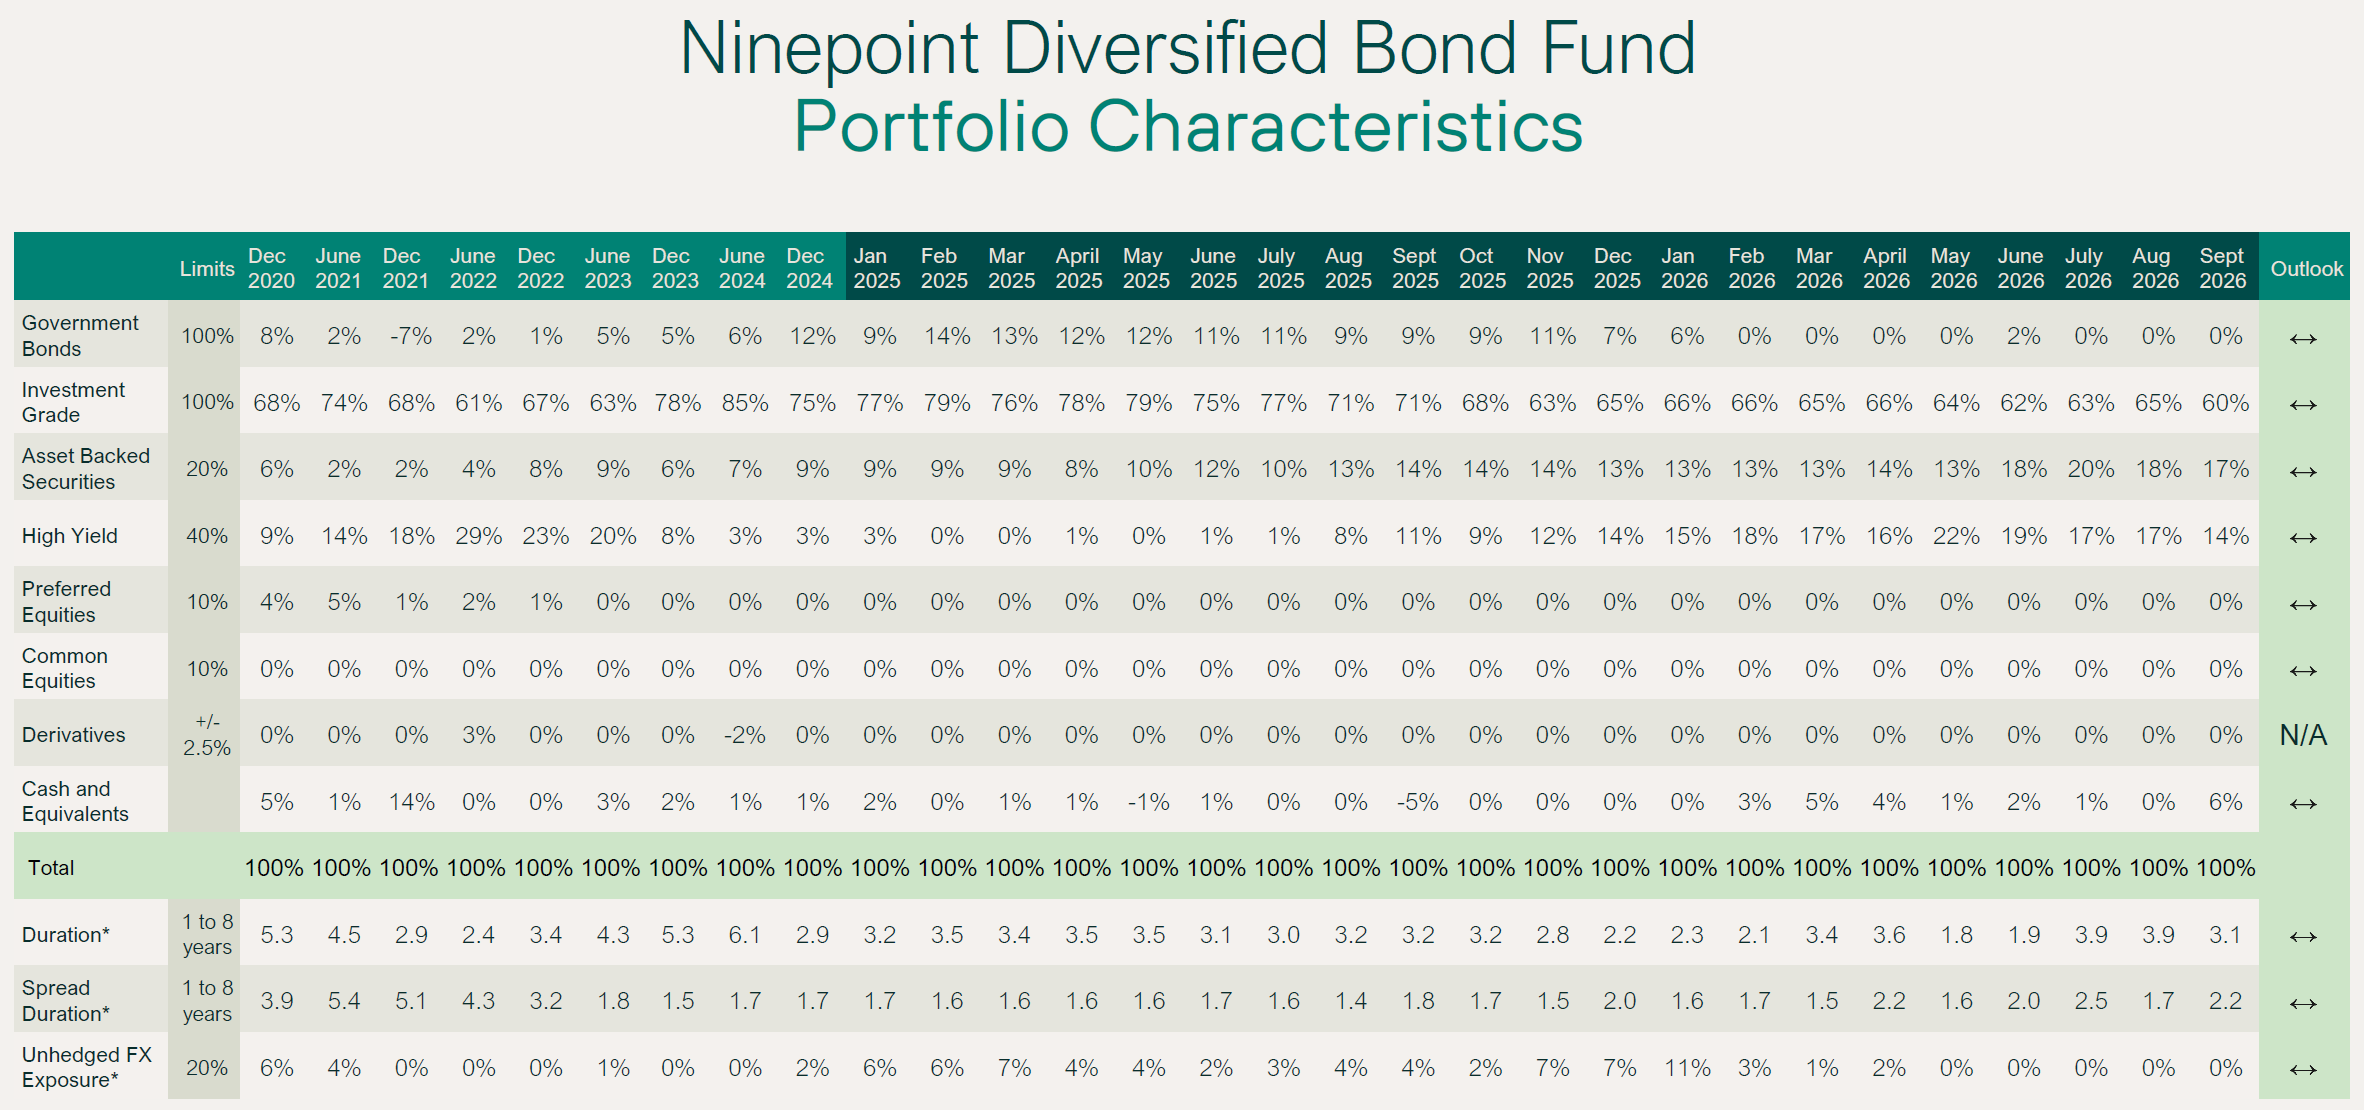
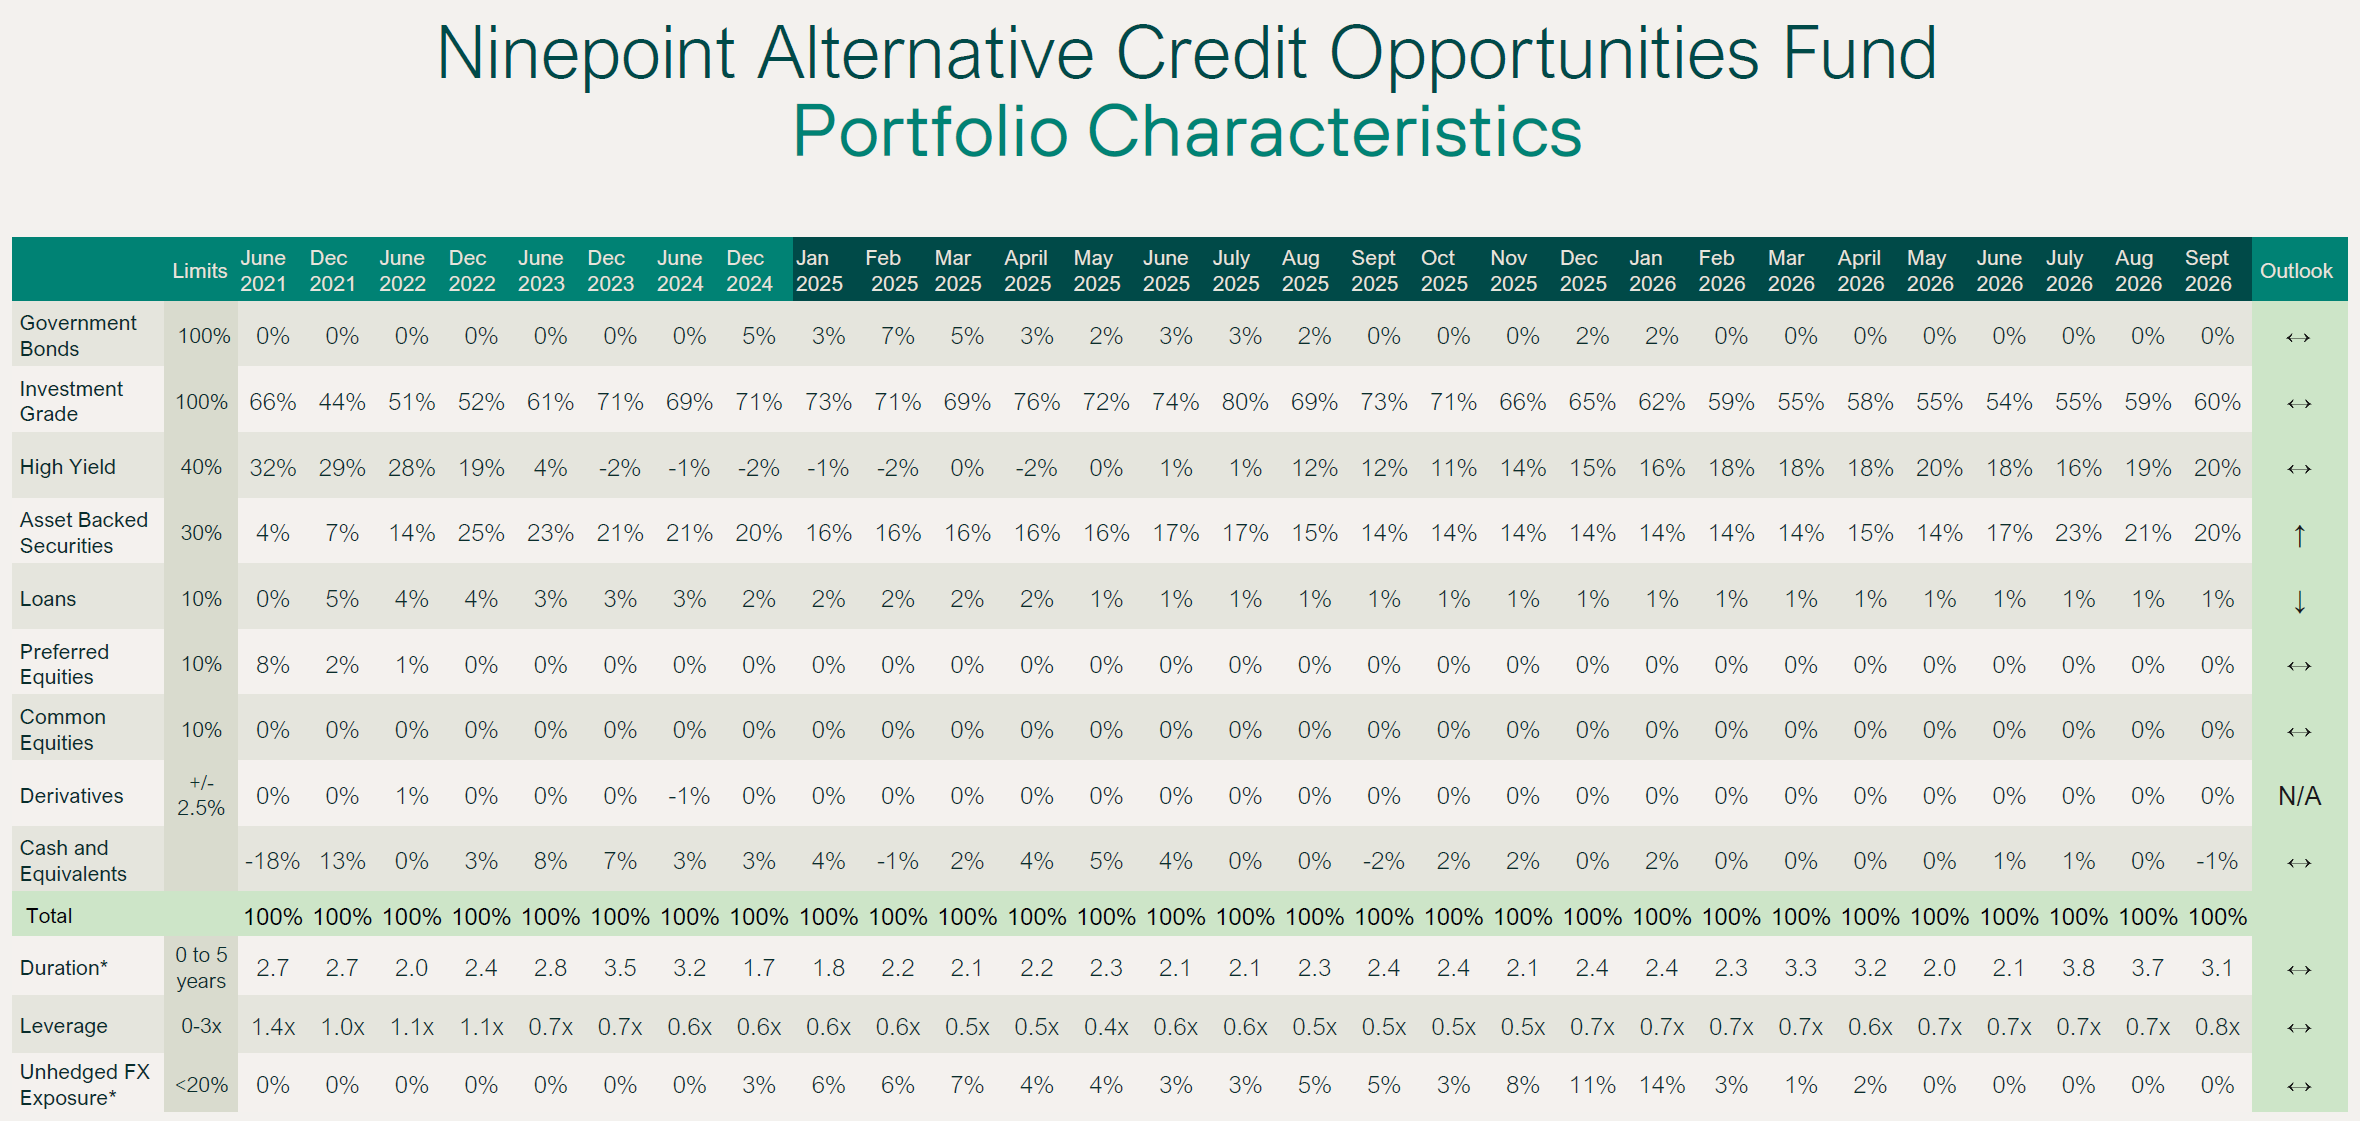
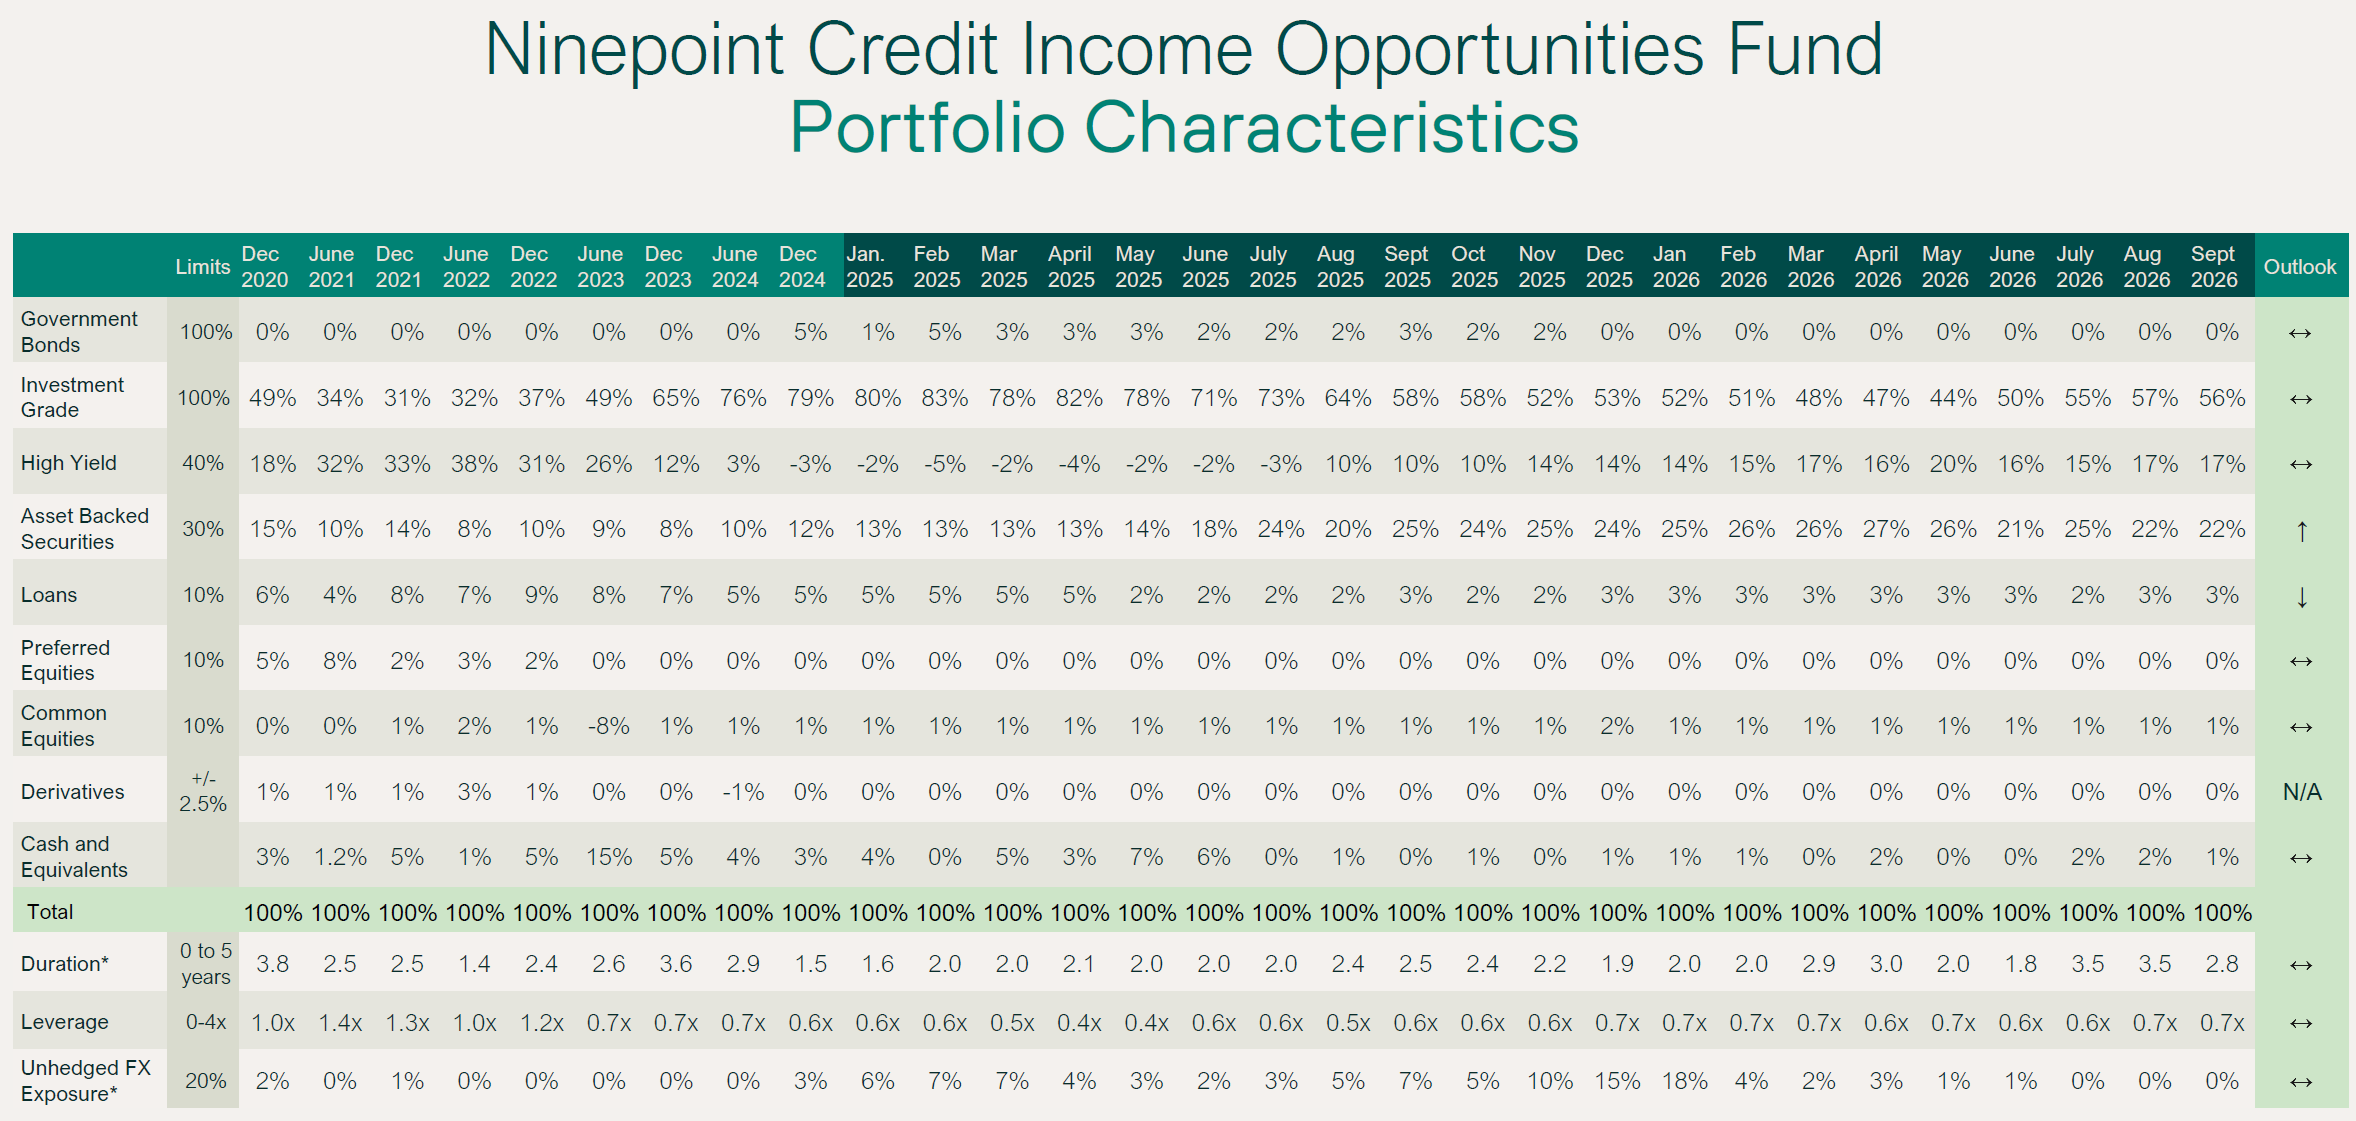
Table 4 below shows the various statistics and exposures as of September month end. We pared back our duration as the sell-off in long-term rates continued. Regular readers will recall that we had dipped our toes in long-term U.S. government bonds using options (sold put spreads to buy calls). With the sell-off gathering pace, we thought it was prudent to close the positions before the put spreads moved into the money, minimizing the damage. Unless things change materially, expect duration to remain between 2.5 and 3.5 years for the foreseeable future.
Portfolio yields remain very healthy, and increased ~40-50 basis points vs last month, reflecting the back-up in interest rates we discussed earlier. Credit duration fell further post month-end as we added another slug of CDX hedges.
Table 4: Fund Characteristics as of September 30, 2026
|
|
Duration (years) |
Credit Duration (years) |
Yield-to-Maturity |
Current (cash) Yield |
Leverage |
|
Diversified Bond (F) |
3.1 |
2.2 |
5.3% |
5.1% |
N/A |
|
Alternative Credit Opportunities (F) |
3.1 |
2.9 |
6.6% |
7.1% |
0.8x |
|
Credit Income Opportunities (F) |
2.8 |
2.7 |
6.5% |
6.9% |
0.7x |
Conclusion
With the massive increases in bond yields this year, and the underperformance of some parts of the credit markets due to the massive amount of AI-related issuance, it has been a real challenge for bond funds to keep their heads above water. Yes, all-in yields are higher, offering a first line of defence against price volatility, but the magnitude of the repricing has been swift.
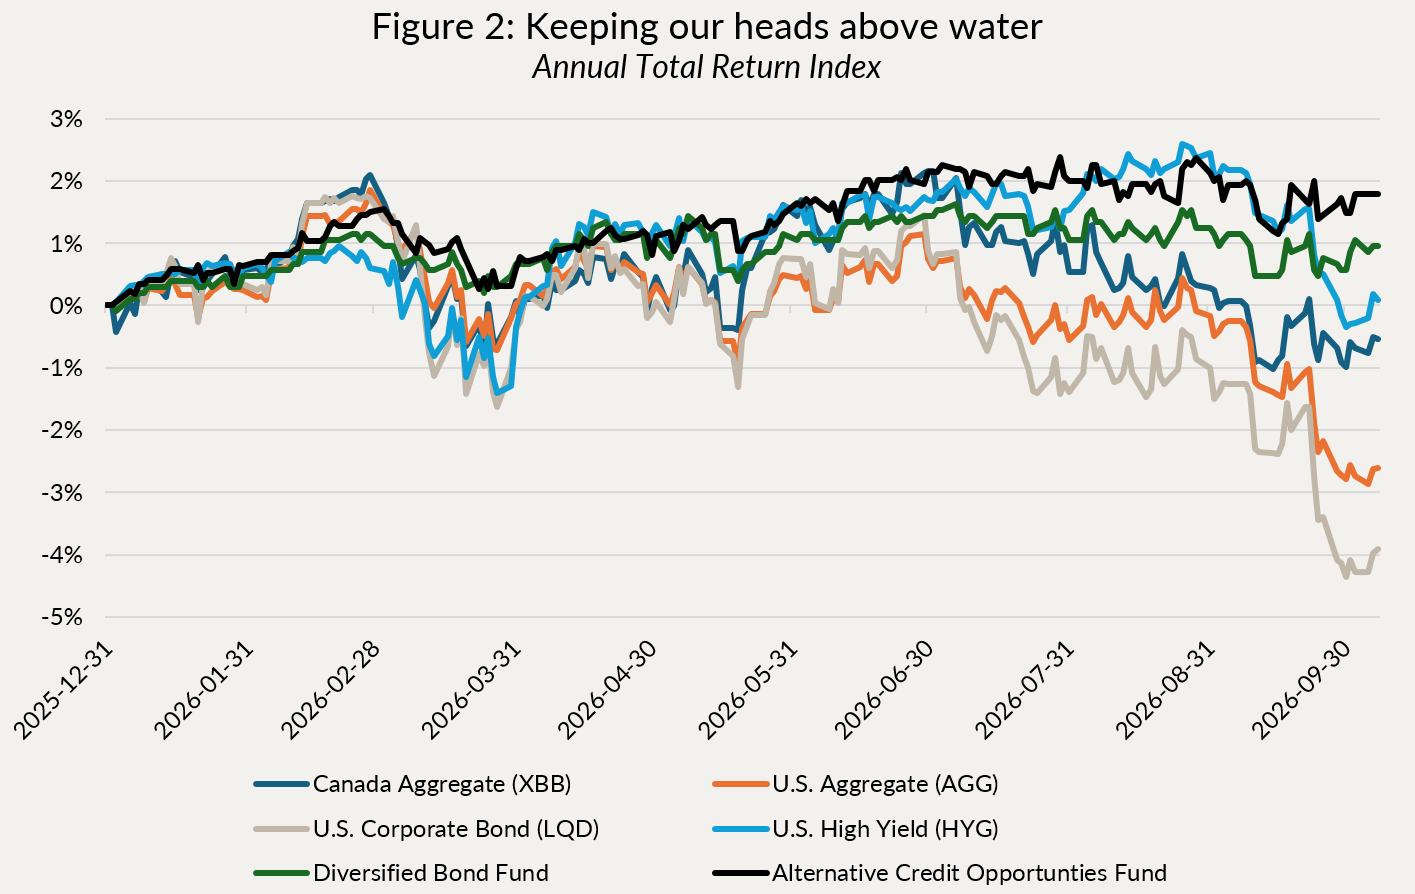
We are therefore happy with the performance of our mandates this year. Figure 2 below shows the year-to-date daily total return index of our two strategies versus Canadian and U.S. aggregate indices, along with IG and HY corporate bond indices. We have so far kept performance consistently positive all year, whereas all of these indices/ETFs have oscillated repeatedly between red and green, and are now mostly down YTD.
Click for larger image
This resilience is a testament to our approach: carefully selected securities to maximize income while minimizing price volatility, dynamic and active hedging strategies to dampen volatility. While 2026 has been challenging for fixed income, our disciplined approach through security selection for income, along with dynamic hedging has delivered. With three months left in 2026, this won’t be a record year for performance, but if history is any guide, our strategies tend to perform well on the other side of rate hike cycles. Performance rebounded significantly in 2019 and 2023 after the 2018 and 2022 drawdowns.
With 100 basis points of rate hikes already priced-in and several arguments that support a shallower hike cycle, we see short-term Canadian bonds as a compelling opportunity going forward.
Until next month,
Mark, Etienne & Nick
As always, please feel free to reach out to your product specialist if you have any questions.
Ninepoint Diversified Bond Fund
NINEPOINT DIVERSIFIED BOND FUND - COMPOUNDED RETURNS¹ AS OF SEPTEMBER 30, 2026 (SERIES F NPP118) | INCEPTION DATE: AUGUST 5, 2010
1M |
YTD |
3M |
6M |
1YR |
3YR |
5YR |
10YR |
15YR |
Inception |
|
|---|---|---|---|---|---|---|---|---|---|---|
Fund |
-0.60% |
0.58% |
-0.86% |
-0.08% |
1.23% |
6.25% |
1.53% |
2.53% |
3.41% |
3.44% |
Click for larger image
Ninepoint Alternative Credit Opportunities Fund
NINEPOINT ALTERNATIVE CREDIT OPPORTUNITIES FUND - COMPOUNDED RETURNS¹ AS OF SEPTEMBER 30, 2026 (SERIES F NPP931) | INCEPTION DATE: APRIL 30, 2021
1M |
YTD |
3M |
6M |
1YR |
3YR |
5YR |
Inception |
|
|---|---|---|---|---|---|---|---|---|
Fund |
-0.59% |
1.31% |
0.62% |
0.71% |
1.85% |
6.87% |
2.58% |
2.72% |
Source: Ninepoint Partners. Subject to change without notice.
Click for larger image
Ninepoint Credit Income Opportunities Fund
NINEPOINT CREDIT INCOME OPPORTUNITIES FUND - COMPOUNDED RETURNS¹ AS OF SEPTEMBER 30, 2026 (SERIES F NPP507) | INCEPTION DATE: JULY 1, 2015
1M |
YTD |
3M |
6M |
1YR |
3YR |
5YR |
10YR |
Inception |
|
|---|---|---|---|---|---|---|---|---|---|
Fund |
-0.89% |
0.77% |
-0.89% |
0.30% |
1.43% |
6.46% |
3.21% |
4.79% |
4.69% |
Click for larger image