
Liquidity as an Investment Feature
Liquidity is an investment feature, much like cash distributions or a redemption option
Liquidity and Risk In An Investment Portfolio
A lack of liquidity has the tendency to be equated to a higher risk investment, however taking a deliberate and measured approach to constructing an investment portfolio with tiered liquidity can improve risk-adjusted returns. Portfolio risk is a chance that the combination of assets fail to meet its financial objectives. Assets can either under deliver on income or have a capital drawdown reducing the portfolio size, where both failures are not based on the liquidity of the investment but the merits of the investment itself. Having liquid investments that are subject to the volatility of public markets can even be a detriment to a portfolio’s ability to mitigate risk by participating in market capitulation in extreme selloffs. The acceptance of illiquidity in a portfolio may create an opportunity for an investor to achieve higher risk adjusted returns, without modifying their investment timeline. Investment liquidity can range from one day to several years and investment products have been developed across the spectrum to match the varying liquidity needs of investors. Institutions have increasingly adopted less liquid investments to capitalize on reduced volatility and illiquidity premiums – that is, return premiums that are paid to the investor to compensate for the lower liquidity of the investment. Unfortunately, many high net worth investors have lagged their institutional counterparts, despite often having longer time horizons that can benefit from these opportunities. In this article, we will begin by defining liquidity and risk as it applies to investment portfolios, then demonstrate how adding illiquid or less liquid strategies to a portfolio can improve the risk-return profile and finally, provide some examples of less liquid investments available to investors today.
The Liquidity Spectrum Within Asset Classes

What is Liquidity?
Liquidity refers to the cost and length of time it takes to convert an investment into cash. A liquid asset in a portfolio allows the portfolio to handle sudden, unexpected cash requirements or to be easily rebalanced via changes in allocations.
It is worth noting that liquidity is a feature that is most easily accessed in normal market conditions. Sudden cash needs for an individual investor can easily be handled by a normal market with most liquid investments. The asset owner is able to reduce their exposure at a moment’s notice, should they change their view or need cash. Unfortunately, if all investors change their outlook in the same timeframe, liquidity can dry up very quickly, leaving investors exposed to material risk.
What is Risk?
The risk in an investment is the possibility of it declining in value. Investment returns are driven by the compensation an investor needs in order to take on an implied level of risk.
Included in investment risk is liquidity risk, which is the risk of not being able to sell your investment at a fair price when you want to. To sell the investment, you may need to accept a lower price and realize a loss on the investment. This risk can provide valuable upside to an investor with a longer time horizon or better forecasted liquidity needs, who generally do not need to access their capital.
Liquidity as a Feature
Liquidity is often an investment feature that is taken for granted when investors evaluate a new allocation. With the rise of passive investing and large allocations to public market indices, portfolios with long time horizons are holding some of the most liquid investments available. What many investors do not realize is that liquidity is an investment feature, much like cash distributions or a redemption option, that is designed to match the investment objectives of the buyer and that many of these investment features have an inherent cost to them. Investors need to construct portfolios with attention to not just return and volatility but also with consideration to the liquidity of underlying asset classes.
The benefits of a liquid portfolio are easy to understand. Being able to get cash out of an investment in a timely manner creates a nimble portfolio that can be re-balanced to match changing market conditions, changes in circumstances for the investor, or can be used to cover unexpected costs. If an investor were to abruptly lose their source of income, a liquid portfolio could be sold to fund the investor’s ongoing expenses—this type of scenario is where liquidity shows its value. However, liquidity costs money and the question that one needs to ask is: does one hundred percent of the investment portfolio need to be liquid?
The cost of liquidity is usually discussed in terms of its opposite — the “illiquidity premium”
The cost of liquidity is usually discussed in terms of its opposite—the “illiquidity premium”. This is the market phenomenon that shows investments with longer lock ups or maturities performing better over time. This phenomenon follows from Keynes’ Liquidity Preference Theory that an investor should demand a premium on securities with a long-term maturity. This is intuitive as the investor is essentially forgoing their opportunity to invest in a new asset while they are invested in the long term security, and therefore must be compensated for that opportunity cost.
According to Harry Markowitz, a Nobel Prize winner and a pioneer of modern portfolio theory, the chief mistake of the small investor is they buy when the market goes up and they sell when the market goes down. Illiquid investments that have the potential to outperform liquid investments require more time to produce profits and to weather different economic cycles. According to various research studies including Amihud, Hameed, Kang, and Zhang (Pricing of Illiquidity as a Characteristic and as Risk, September 2015) and Ilmanen, Chandra, and McQuinn (Demystifying Illiquid Assets, Winter 2020), there is a positive correlation between expected return and illiquidity. The value of liquidity can be demonstrated in the bid-ask spread of an asset – the difference between the highest price that a buyer is willing to pay for an asset and the lowest price that a seller is willing to accept. For example, we can assess the bid-ask spread of S&P 500 and the S&P Small-Cap 600. As of August 2023, the 30-day median bid-ask spread of S&P 500 was about 0.00%, in contrast to the 0.07% of the S&P Small-Cap 600. (Source: Vanguard) These bid-ask spreads are the costs associated with transacting a given security and also reflect the informational asymmetry between buyers and sellers.
Inherently, private markets are less liquid than public markets. Consequently, private markets are expected to generate higher returns. For example, comparing the Cambridge Associates Private Equity Index and S&P 500, over the past 10 years, we can see Private Equity has generated 16.95% annually compared to public equities at 12.23%.
Market volatility can add to the cost of liquidity, where the option to sell your investment inherently means that anyone else holding that investment also has that option. By holding a liquid security, the investor exposes their portfolio to the will of other market participants. This will, driven by market participants (the “herd”), is often irrational, which can be seen through the massive market surges and selloffs through time. The volatility (standard deviation) of an investment is frequently used as a proxy for the risk of the investment and liquidity enables these securities to trade far outside the range of a fundamentally based value.
Illiquidity as a Feature
Despite all the benefits of liquidity, an illiquid asset can prevent investors from running with the “herd”, particularly during times of extreme market volatility. In the midst of market corrections, the most common investor reaction is flight to quality. Investors normally re-enter the market once conditions have stabilized.
By doing so, the investors are trying to time the market. Typically, market corrections occur during times of economic stress and uncertainty which makes it extremely difficult to know the optimal time to buy or sell. Figure 1 displays the consequences of missing the best days during market corrections. An investor who missed the 10 best days in the equity market would have earned 5.5% less than if they would have stayed fully invested during the same time period. Although public assets are liquid, exiting during a market correction would typically mean you would be forced to sell below an investment’s intrinsic value.
Figure 1: S&P 500 Performance During Market Corrections FY2007-FY2022

Source: Putnam Investments
Like the famous saying, “anything can be sold and bought for a price”, even less liquid investments can be sold quickly to generate liquidity when it is priced below its intrinsic value. But, it is important to remember that selling an asset that was designed to be held for the long term to generate cash in the short term completely misses the point of why less liquid investments were bought in the first place. Long-term investment strategies are typically run by managers who have the experience of managing “through-cycle” investments and know how to maximize investment value.
Private Debt Investment Example
Let’s consider a scenario where an investor invests in a Private Debt fund. The fund manager will pool all investor proceeds and use that money to make loans to selected SMEs (see Table 1).
In this case, one of the portfolio loans is a 3-year, $10 million senior secured loan at 10% interest that is made to a commercial blinds and drapes manufacturer (the “Borrower”) with first lien over the accounts receivable, inventory, equipment and real estate, totaling a net orderly liquidation value of $15 million and a forced liquidation value of $10 million. This company has been in operations for over 50 years and has built strong relationships with home builders in the region.
The Borrower has recently defaulted on the loan in Year 2 due to its underperformance during the winter months (its slow season). If investors need liquidity, they may request of the fund manager to redeem their investment to mitigate feared losses. This redemption could potentially cause the manager to force liquidation of the Borrower’s assets in absence of any other sources of liquidity from within the portfolio. In this scenario, the loan would be paid from proceeds of liquidation and investors may not get 100% of the principal back and also lose out on the potential upside this investment would have generated if the loan had not been called prior to maturity.
If investors remain invested, the fund manager may not force the Borrower to liquidate the collateral and, with the Borrower, would have the opportunity to evaluate several exit plans and choose the one that maximizes the return on investment. In this case (see “Remain Invested Scenario” below), the borrower fails to make its interest payment in Year 2 and the lender remains invested. By the end of Year 3, the borrower performs better than expected, cures its default and catches up on payments which generates 9.7% Internal Rate of Return (IRR) vs. 5.1% in the forced liquidation scenario—adding 4.6% to its IRR before accounting for other penalties such as default interest or additional fees. It is crucial for the lender/fund manager to evaluate all the available options in a workout scenario and develop an appropriate strategic plan to maximize its return on investment.
Table 1

Product Structuring
Prospectus Based Funds (Mutual Funds) versus Offering Memorandum Funds (Private Funds)
Product features, such as liquidity are taken into account when asset management firms structure a new product. For example, contrast a typical openended mutual fund that trades in public equity securities versus a Private Equity or a Private Debt fund that invests in private companies. These are both investment vehicles with the goal of investing in a company, but have vastly different structures and return profiles.
Mutual funds are generally traded daily, with all subscription and redemption orders taking place at the end of a trading day. Investors that wish to liquidate receive their money back within two business days of their trade date and investors that want to subscribe can gain exposure to the market in one day. This is possible because the underlying investments are broadly traded, resulting in higher degree of liquidity that private investments cannot provide. The typical mutual fund is designed to exist in perpetuity.
Private Equity and Private Debt funds are structured very differently, with long lock-ups and an investment timeline of several years being the norm. A typical Closed-End Private Debt Fund would have a lifespan of about 5 years, with options for the manager to extend that lifespan, while a venture capital fund would have a lifespan of about 7 years with extension options. An investor in this structure has no way to access their cash invested, unless distributions are made by the manager. In order to liquidate the investment, they would need to sell their stake in the fund to another investor in a secondary transaction, which is difficult to broker and is very often at a heavy discount to Net Asset Value (NAV).
For open-ended managers, balancing liquidity is essential. In order to manage capital deployment for investments with incoming subscriptions, outgoing redemptions and distributions, fund managers structure products with redemption caps. This helps to minimize liquidity crunch. As no investment is immune to economic cyclicality, investors can become irrational during downturns and look to get money back at the first opportunity, ignoring the long-term benefits of staying invested. Experienced fund managers take a long-term view to withstand such downturns to generate returns and require redemption limits to do so, particularly for open-ended funds. Open-ended funds include quarterly redemption caps to better balance liquidity for existing subscribers and prospective redeemers.

Source: FS Investments Liquidity Paradox.
The structure of the fund must match the underlying investments. A fund which invests in long term equity in private companies could not possibly provide liquidity to investors with one day’s notice, as they are simply unable to get the cash out of their investment in such a short time period. An investor must be cognizant of the difference between product structure and the underlying asset to catch potential red flags.
Mutual funds and private funds have similar goals but look very different in structure and return profiles. As of March 31, 2023, the S&P 500 Index, a public market benchmark, returned 12.23% annually over 10 years. In contrast, the Cambridge Associates US Private Equity Index returned 16.95% annually.
Compounding that difference over the 10 years would make a $10,000 original investment worth approximately $16,172 more in a Private Equity investment versus public.

Source: Bloomberg, Cambridge Associates
Similarly, contrast a Public Debt index such as the ICE BofAML US High Yield Index, and a Private Debt benchmark created by Cliffwater. Over the past 10 years ending March 31, 2023, the ICE BofAML US High Yield Index returned 6.34% annually. Over the same period, the Cliffwater Direct Lending Index produced an 8.84% return. Compounding that difference over the same period would make a $10,000 original investment worth approximately $4,836 more in a Private Debt investment versus public.

Source: Bloomberg, Cliffwater
The stark contrast between investment values over the time period has a variety of contributing factors. Private Equity and Private Debt often require a higher minimum investment, have greater complexity and require the investor to stay long-term to benefit from fund investment. These factors are seen as features that the investment must compensate the investor for and therefore include a return premium.
Retail-Focused Private Investing
When a typical retail investor is looking to invest in private markets, their options are limited. Most private funds were designed to cater to institutional investor needs, with very long lock up periods and minimum investments that are prohibitive to portfolios with time horizons shorter than 10-15 years. This is beginning to change – many new Private Equity and Private Debt funds are being structured to meet several retail investor requirements without sacrificing the integrity of the investment strategy.
These retail-oriented products have lower minimum investments, shorter time horizons and more liquidity features. While some of the benefits of long-term investments are compromised, these more liquid private investments give retail investors access to the private markets and offer some of the benefits previously unavailable.
In order to shorten the investment time horizon in a retail private market investment, the manager can add what is called a liquidity sleeve. This would be a portion of the portfolio invested in public markets to provide a buffer which introduces some liquidity to the private investment. Another way of shortening the portfolio’s overall time horizon would be a layering approach to the investments. This is often seen in fund-of-fund or multi-strategy funds which layer investment vintages, allowing the underlying investments to mature in a “waterfall”, providing consistent liquidity to the investor.
Outside of the portfolio investments, a product can be structured to manage the liquidity of the underlying fund. By including a redemption notice period and an initial investment lock-up in open ended structures, a fund manager can help align investor behavior to the portfolio objectives. Generally, long-term investments, such as Private Debt or Private Equity, require time for the fund manager to season the portfolio and exit transactions. By having this language in the offering memorandum, the fund manager can manage the portfolio to the liquidity demands of the client well ahead of when cash is required.
Figure 2: Alternative Asset Allocation for Pensions, Endowments, and Individuals

Source: OTPP, OMERS, CPPIB, Blackstone, Goldman Sachs
Figure 3: Correlation of Traditional Asset Classes to Global Equities

Source: Bloomberg
Having access to private market investments can complement an investor’s public investments, resulting in institutional type returns for the given levels of risk. With the democratization of private market opportunities, asset management firms have begun to bridge the “access gap” between institutional investors and retail investors.
Constructing Your Portfolio to meet Investment Objectives
Portfolios of the world’s leading pensions, endowments and other institutional investors hold approximately 51%-56% in alternatives. This generally consists of private and illiquid strategies. In situations have increasingly moved towards alternatives given the changes in the public markets. As public markets become more efficient with the improvements in technology arbitrage, pricing opportunities become harder to find. Prices reflect all available information, making it increasingly difficult for active managers to generate alpha in the public markets. Looking at Figure 3, traditional asset classes no longer provide the same level of diversification and have progressively become more correlated to one another, especially during market selloffs when investors flee to safe assets. Institutions are well aware of these changes in the market and have adapted their portfolio allocation model.
For their part, pensions, foundations and endowments typically allocate assets using the “Endowment Model”. This model allocates a large part of the portfolio into alternative investments to generate strong risk-adjusted returns to ensure there will be sufficient liquidity to meet its obligations and liabilities. As shown in Figure 4 on the next page, the top U.S. endowments have outperformed the traditional 60/40 portfolios by a minimum of 2%, annualized over the past 10 years. Yet, according to a 2023 Goldman Sachs study, the average high net worth investor allocates just 9% of their portfolio to less liquid alternative investments. Access to such investments has certainly played a role, but differing investment time horizons has represented a more material explanation.
That said, as retail investors increasingly gain access to less-liquid alternative investment strategies, they need to be sure not to confuse illiquidity with increased risk to a portfolio. By definition, liquidity risk is the risk of not meeting short-term obligations. This is mitigated by matching the portfolio liquidity to future liabilities. The investor must conduct a thorough analysis on their own cash requirements and include a safe margin for unexpected expenses that may arise. Optimally allocating to liquid and illiquid/long-term strategies will not drastically increase risk – in fact, an allocation of 5-30% to less-liquid alternatives may have the opposite effect. With that addition, the investor will be better positioned to take advantage of the benefits of these strategies, including lower correlation to the public markets, portfolio diversification, and strong risk adjusted returns.
Figure 4: U.S. Endowments Annualized Performance Over 20 Years, FY2002-FY2022
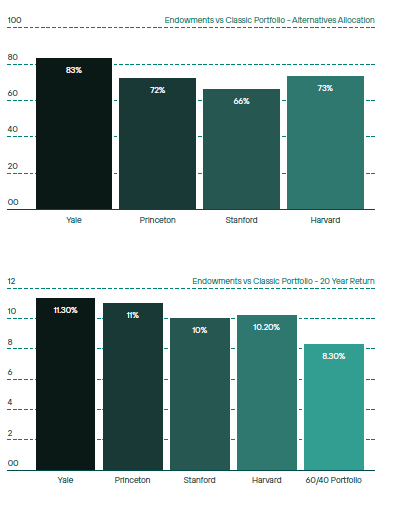
Source: Yale University Financial Report, Princeton Reports, Stanford University Financial Report, Harvard University Financial Report, Bloomberg. As per data available as of August 2023.
about Alts?
You might also be interested in...


Toronto, Ontario M5J 2J1 Canada