Ninepoint Gold & Precious Minerals Fund
Q2 2023 Commentary
Gold vs. Gold Stocks, An Unresolved Incongruity
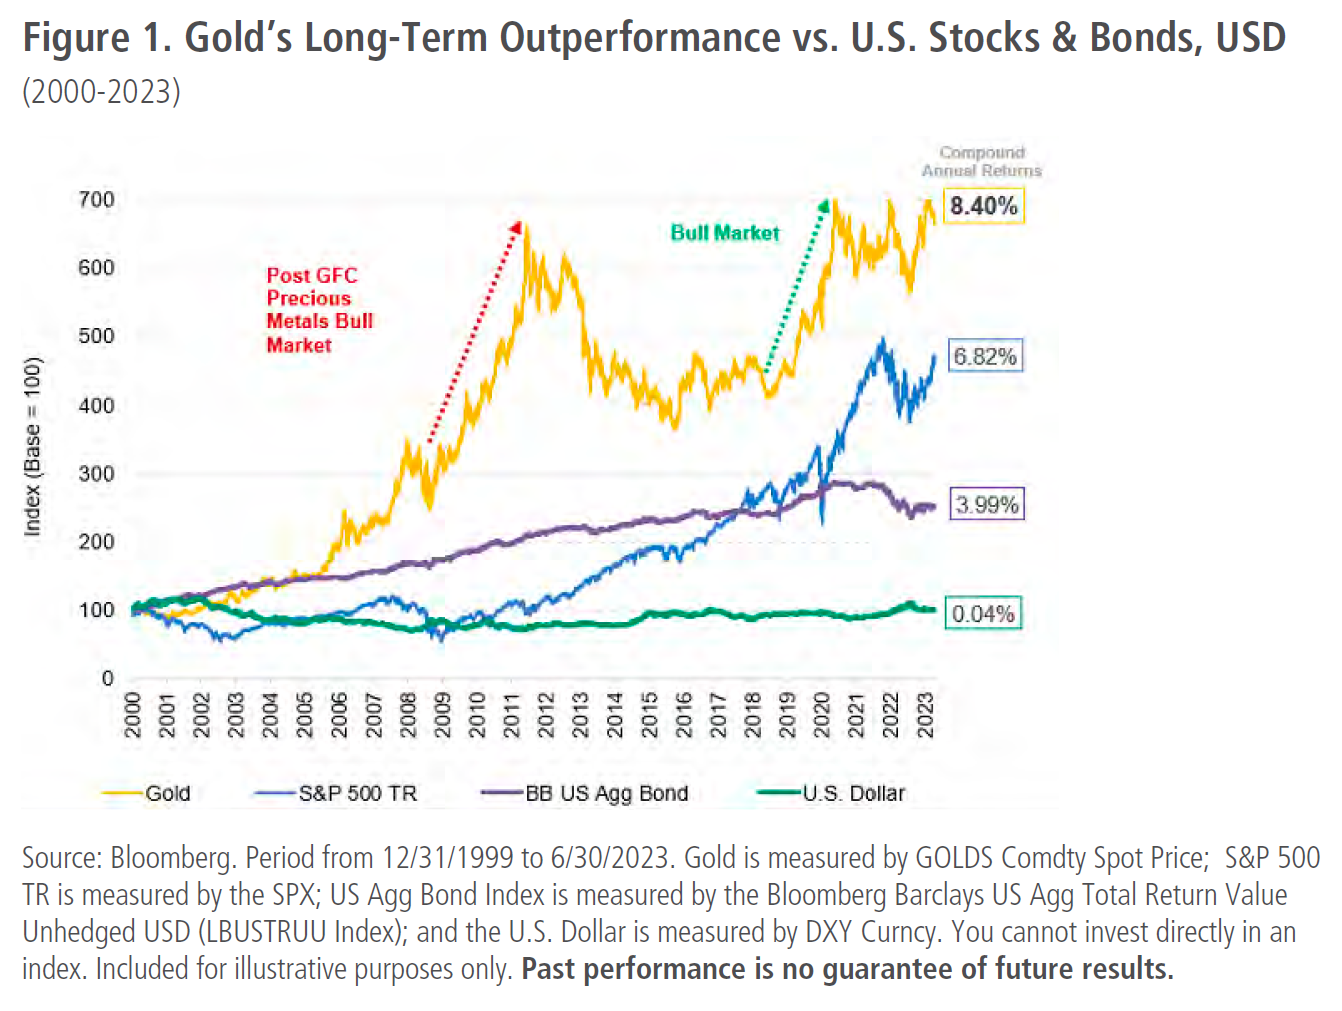
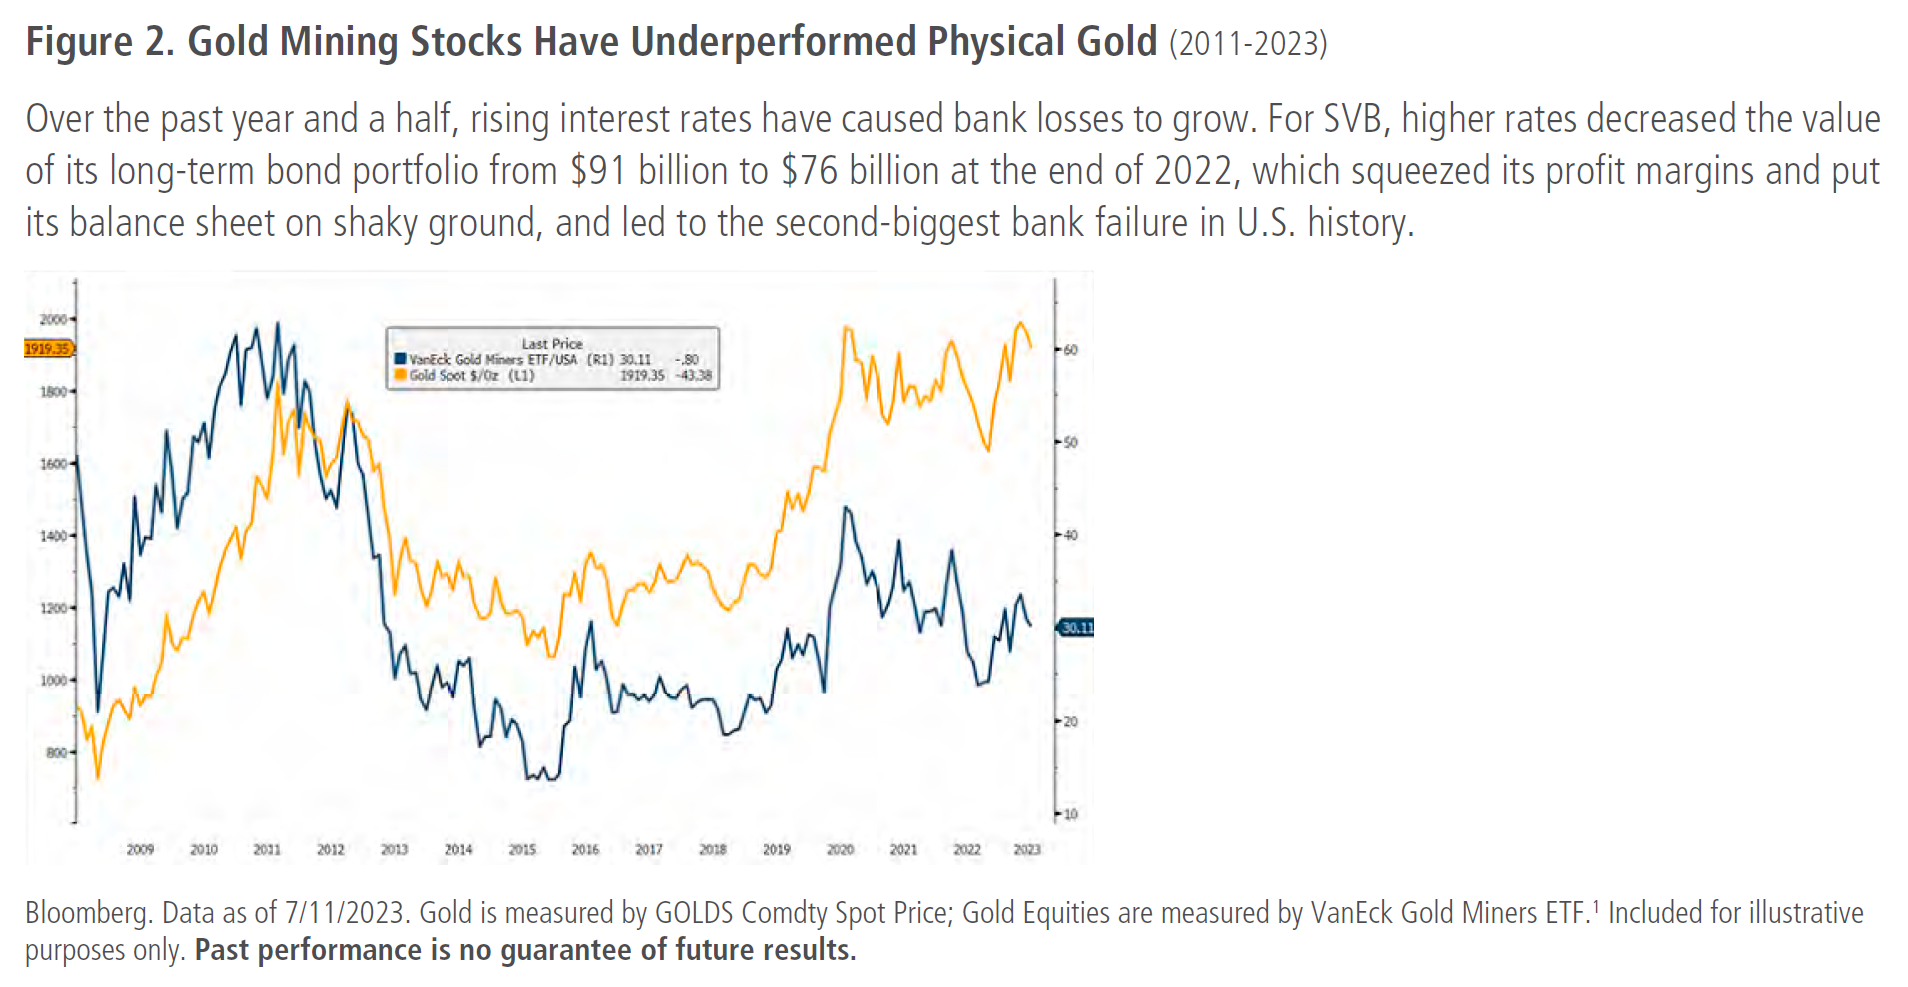
Since 2000, the dawn of radical monetary policy, gold has outperformed the major asset classes, as depicted in Figure 1. In the first decade of the gold bull market, mining equities significantly outperformed bullion. However, following gold’s August 2011 peak, gold mining equities have significantly underperformed the metal’s price, as shown in Figure 2. There are several possible explanations for this incongruity, many of which are already reflected in the ultra-low valuations of gold mining stocks. These reasons will be reviewed and discussed in the following paragraphs.
Of the several reasons for underperformance, the most significant impediment to higher gold stock valuations, in our opinion, is the implicit consensus that gold priced in the current neighborhood of $2,000 per ounce is not sustainable. We believe the notion that gold mining stocks offer perpetual optionality and leverage to still higher gold prices is heavily discounted, even dismissed when weighing their pros and cons. Currently, physical gold is trading a few percentage points below its all-time highs (~$2,075 in August 2020). In our view, there is realistic potential for a mean reversion trade in which a small percentage gain in the gold price above its previous peak may lead to outsized returns for gold mining equities.
Gold Mining Equity Underperformance: Unpacking the Reasons
A. Dilution
In our opinion, share issuance is one of the major reasons for the disconnect between the gold price and mining equities. Share issuance has often been a necessary but justifiable evil to finance capital projects. However, in all too many instances, share issuance has resulted from poor capital discipline, ill-advised M&A (mergers and acquisitions) and disregard of per-share metrics concerning reserve and production ounces, cash flow and earnings. Few corporate websites or investor presentations display these per-share metrics, depriving investors of a clear and accessible method to analyze management performance. Although the impact of equity dilution is disclosed in financial statements and is routinely researched by the Sprott investment team, deciphering the debilitating effect of serial dilution is a laborious task that most generalist investors may be reluctant to undertake.
B. Subpar Return on Equity (ROE) or Misallocation of Capital
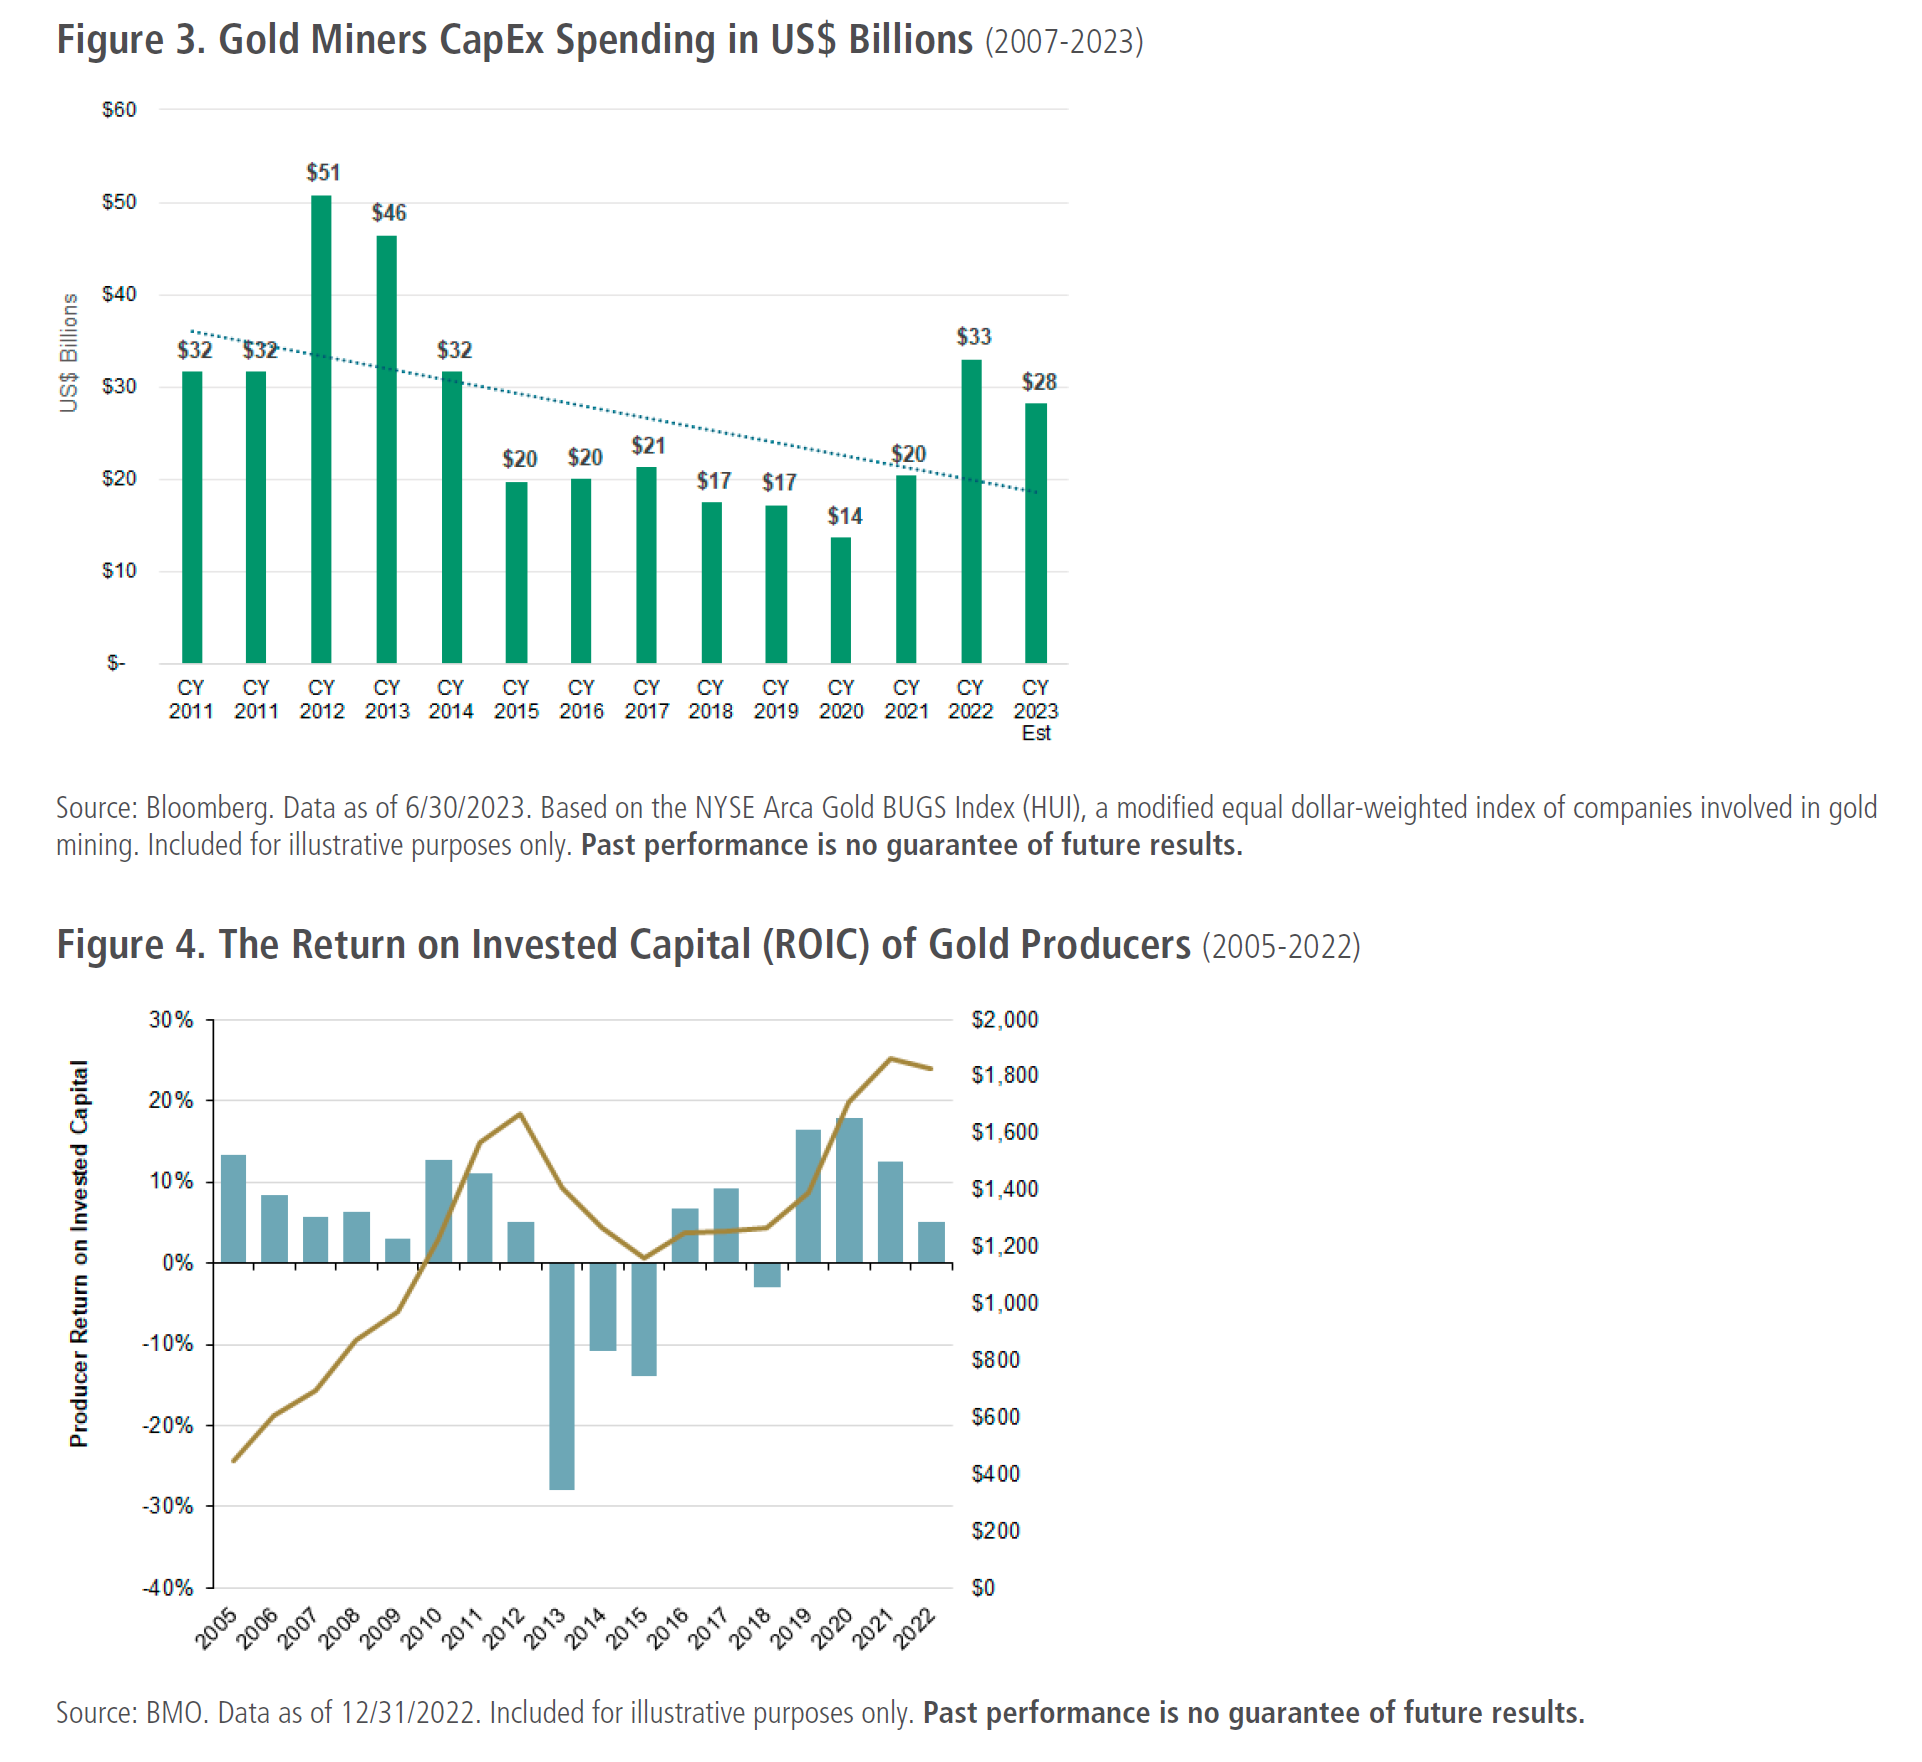
Figure 3 illustrates how the 2011 gold price peak triggered a CapEx (capital expenditures) surge in 2012 and 2013. The drop in the gold price after 2011 doomed the industry to subpar returns on capital for the next five years.
Following the 2012-2013 CapEx binge, the gold mining industry drastically cut expenditures from 2015 to 2021, in response to declining gold prices and profits. Although CapEx spending began to recover in 2022, the level (not inflation-adjusted) still fell far short of the peak 10 years prior, despite current global mine production being ~20% greater than a decade ago. We believe that this CapEx drought means that capacity added during the industry’s nuclear winter (2013-2020) translates into unrecognized scarcity value. In all probability, the replacement cost of existing capacity markedly exceeds the stated book value. The hurdle rate to build new mines will most likely require significantly higher metal prices.
C. Jurisdictional Risk
The spread of resource nationalism to many developing countries, which host otherwise attractive gold deposits, has escalated the risk premium for large new capital projects. In our ongoing internal assessment of geopolitical risk, we’ve seen a significant contraction in the map of favorable jurisdictions over the past decade. We perceive the rule of law to be compromised in many jurisdictions across Latin American, Asian and African nations. Political risk has resulted in a difficult-to-overcome valuation discount for companies with production weighted to certain regions. To address this jurisdictional valuation handicap, many companies are acquiring assets in politically “safe” locales, mainly in North America and Australia. As a result, we’re seeing a rise in M&A activity driven by a desire to alter the geographical footprint.
D. A Decade of Margin Erosion
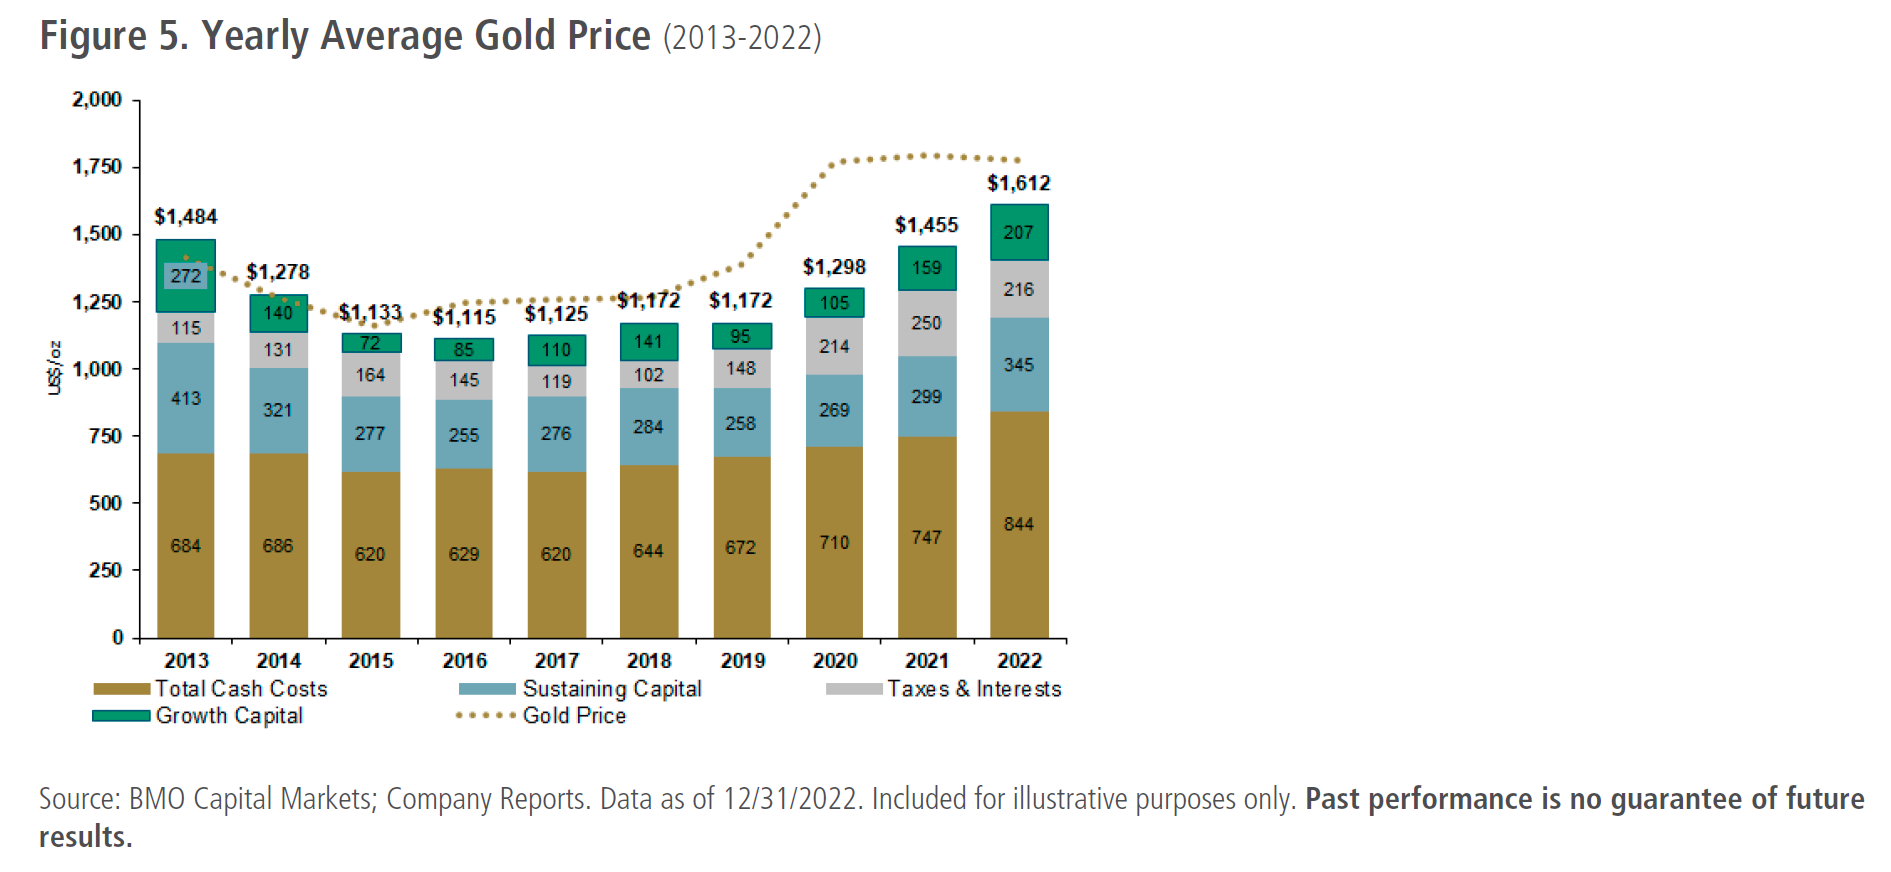
In 2013, the average AISC (all-in-sustaining costs) for gold production was $1,100 per ounce. Today, it stands at roughly $1,250, representing an increase of 13.6%. The yearly average gold price is shown in Figure 5. Using estimates from BMO Capital Markets, the AISC, including growth capital, has risen over the past decade from $1,484 to $1,612 per ounce. The potential for margin improvement, which started in 2019, has been overshadowed by the escalating cost of production and the capital expenditure required to replace existing capacity and reserves. However, we believe that the trend of margin eroding cost inflation is beginning to plateau and may soon be a thing of the past. If bullion prices stabilize at current levels, the prospects for industry-wide margin expansion could be excellent.
E. CapEx Bloat/Timeline Stretch
The timeline for constructing new mining and processing capacity has lengthened over the last decade. One major reason for this is the increasingly stringent permitting requirements related to environmental and social factors. The time gap between the discovery of a significant new ore body and cash generation now easily exceeds 10 years compared to 6 years only a decade ago. This increased timeline translates into capital being tied up without returns for prolonged periods, leading to higher interest burdens and heightened susceptibility to various risks, including supply chain disruptions, weather events and political changes in host countries. Particularly vulnerable are mine developers with single or few assets, as they often face
unavoidable and unanticipated dilutive financings.
Launch of GLD and other Gold Bullion ETFs
Prior to the launch of SPDR Gold Shares (GLD) in 2004, equity investors bullish on the gold price had no alternative but to invest in gold mining shares. The overwhelming success of GLD and other instruments backed by or closely tied to the physical metal has cannibalized demand for gold mining shares. In 2010, the aggregate market capitalization of gold mining equities stood at roughly $300 billion. By the end of 2022, this figure had dwindled to approximately $260 billion. In contrast, goldbacked ETFs had accumulated assets totaling nearly $180 billion by the end of 2022. Gold exposure for equity investors, once the exclusive realm of mining shares, is now shared with highly liquid gold surrogates traded worldwide. An obvious question arises: What role do gold mining stocks play in constructing investment strategy? The subsequent paragraphs will aim to provide an answer.
Mean Regression Ahead?
Gold mining stocks are inextricably connected to the price behavior of gold bullion. In our view, a bullish outlook for the metal far outweighs any other rationale for owning them. As we have seen, the response of gold mining equities to the bull market in bullion has been disappointing.
What appears to be lacking is a decisive bullion price breakout that leaves the psychological $2,000 per ounce threshold in the rearview mirror. We anticipate that such a breakout is on the horizon, potentially in the not-so-distant future. However, until it materializes, it remains a macroeconomic speculation entertained by few. Our speculative reasoning can be explored further in previous commentaries (Is My Money Safe?, Connecting a Few Dots and The Dollar, Safe Haven or Leaky Lifeboat?). Perhaps the gold price needs a period of further consolidation to digest its ~6% year-to-date gain and the ~60% increase since the August 2018 low. In our view, any further period of uncertainty regarding the potential upside in the gold price provides the last opportunity to allocate into this neglected sector at highly advantageous valuations.
Gold bullion has unequivocally demonstrated its long-term value as a risk diversifier. The notion that it deserves to be positioned as a defensive anchor in a balanced equity investment strategy (and perhaps in a more meaningful ratio than fixed income) is gaining traction. Yet, the broad acceptance of this notion has not sparked significant investment flows. Given escalating macroeconomic risks, the fact that gold remains under-owned appears as incongruous as the disconnect between the metal and its related mining shares this sector at highly advantageous valuations.
Gold Acts as a Portfolio Risk Diversifier and Safe Haven Asset
The investment rationale for gold is easily summarized as a risk diversifier and a safe haven asset without parallel. The argument has been set forth in clinical and academic terms by many credible proponents. Convincing discussion of its benefits in terms of efficient frontier analysis can be found (see World Gold Council: The Case for a Strategic Allocation to Gold). More controversial and less clinical is the idea that gold mining stocks might add tactical investment performance that could far outsize investment performance benefits from the plain vanilla prospects for the metal.
The time for accumulation is now, not after the investment case becomes obvious based on a new gold price paradigm that $2,000 is the floor, not the ceiling. A major barrier to the mean reversion thesis for mining stocks is the confusion between nominal and inflation-adjusted prices. Based on recent history, the superficial view is that when the metal price approaches the magic number of $2,000 per ounce, the potential for further upside is exhausted and a signal to initiate short positions. On an inflation-adjusted basis, today’s $2,000 gold price is ~30% below the peak in 2011 and ~50% below the peak of $800 in 1980. Fixation on nominal prices ignores the fact that macroeconomic realities in favor of gold have improved significantly since previous peaks.
The total market cap of all precious metal mining equities traded on developed markets is ~$260 billion today, slightly more than the market cap of Bank of America. The total market cap of the combined five largest precious metal mining companies is nearly $150 billion, leaving a mere $120 billion for all remaining precious metal mining equities. Imagine the scramble if pension funds like CalPERS or Ontario Teachers were to decide to invest just 1% of their assets into precious metal equities. This is not an outlandish thought. Pension funds in developed markets like Canada are benchmarked against indices with
higher weighting in precious metal miners than in the U.S.
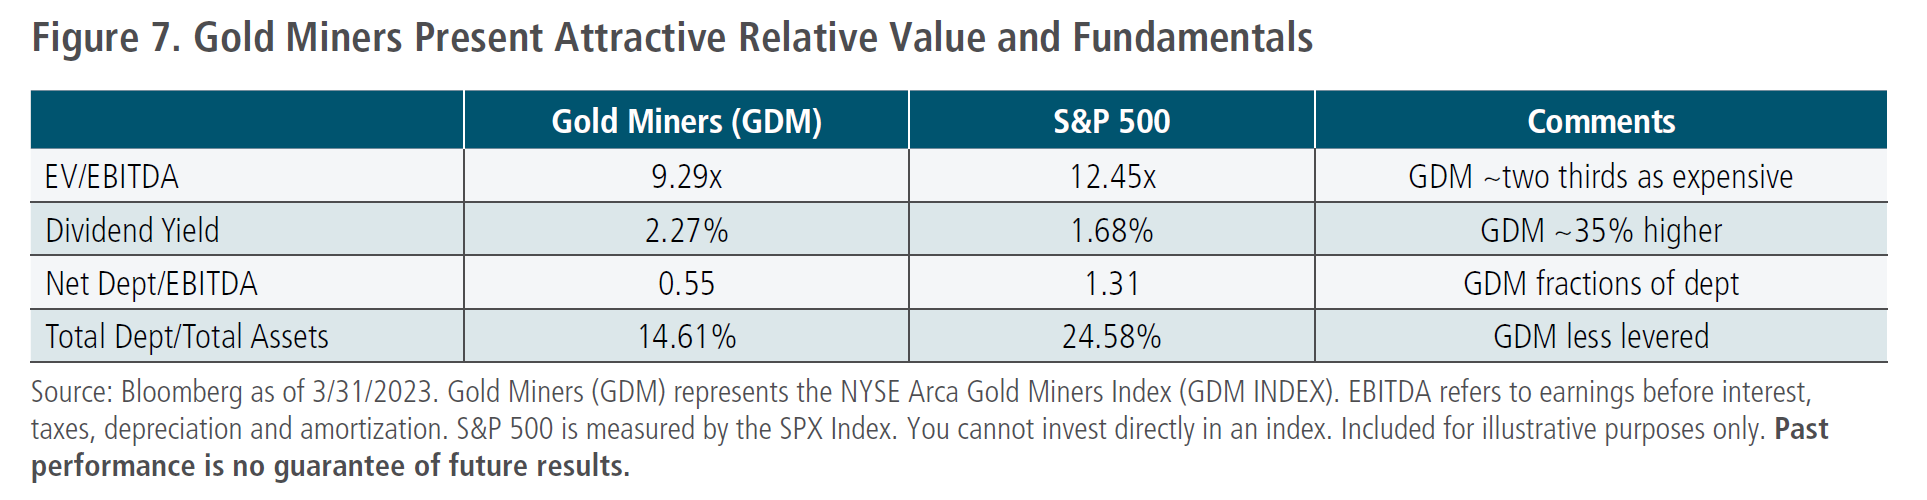
Gold Stock Undervaluation
We believe gold mining stocks are undervalued on a relative and absolute basis. Gold mining equities are trading multiples lower than the S&P 500 Index and with greater profitability and lower leverage.
A decade of subpar investment returns has put a squeeze on exploration expenditures. We estimated that the cost of discovering new ounces has risen over 100% over the past decade. As already discussed, the barriers to building new mines have increased significantly due to geopolitical and permitting issues. These three factors suggest that the value of existing mines is extremely understated on industry balance sheets. The replacement cost of the current mining infrastructure is potentially 30% to 100% higher than that represented by financial statements and the amount of depreciation that has been added due to the age of the project in question.
Systematic Undervaluation of Mining Equities
The conventional valuation methodology for gold miners is based on discounted cash flow (DCF) analysis. The three inputs for the calculation are existing reserves, the cost of producing those reserves and the future gold price. After discounting future cash flows at a uniform time value of money, the DCF analysis arrives at a net asset value (NAV) and, when compared to the enterprise value of any given company, provides a premium or discount to NAV. Only the first factor is objective, while the second requires expert analysis of the particulars of a company’s producing assets. The third and most critical factor is the future gold price.
The conventional practice to model future cash flows, among almost all highly influential brokerage analysts, is to employ spot metal prices for the current and following year, after which a secular decline in the price is imposed. As noted by Michael Solomon, discounting the future gold price arbitrarily impairs valuation and contravenes gold’s historical annual appreciation rate of 8% in USD terms since 1971. Moreover, Solomon notes: “A DCF analysis of any typical company would value the first five to ten years of estimated free cash flows and would calculate a terminal value on the assumption that the business is a going concern.” One method would be to apply a multiple to the final year and discount that back to the present. Solomon goes on to say: “Yet, gold mining analysts assume no terminal value for a mining company. ... The assumptions underlying the discounted cash flow analysis are far from realistic, and it becomes punitive.”
One could argue that even a flawed valuation methodology, if applied consistently, at least enables an effective ranking of different company fundamentals. To this we say that comparative analysis aside, the depiction of valuation through a negatively biased lens affects the appraisals and impressions of generalist investors who might be investigating the gold mining sector for the first time. It can be none other than off-putting.
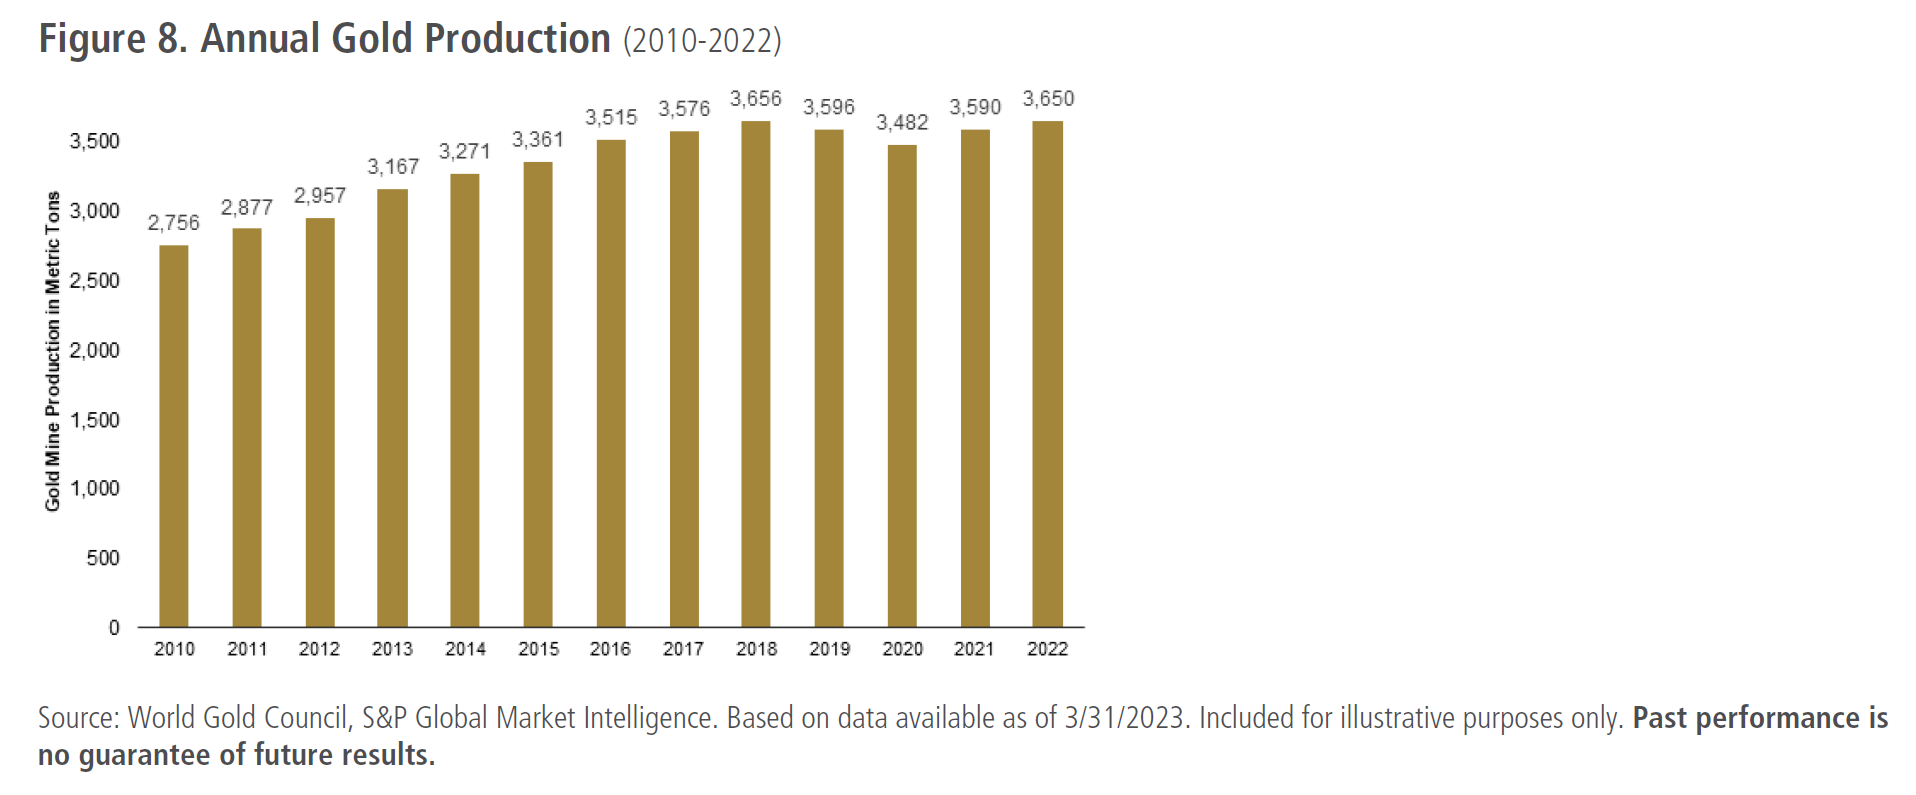
In addition, the auto bearish framework corrupts the thinking of gold mining managements resulting in underinvestment. This can be seen in the already depicted secular decline of exploration expenditures and a long-term constriction on future global production. Given the ever-increasing lead times between discovery and new mine completion, further contraction in reserve-to-production ratios is inevitable. It can be seen in Figure 8 that global gold production is beginning to flatten out:
A consequence of underinvestment in future gold production will be increased M&A activity when major producers have little alternative but to take out smaller producers at substantial premiums. As noted by Solomon, the growing wave of M&A within the gold mining industry can be seen as a “Darwinian response to extinction.”
The prioritization of discounted cash flow (DCF) models to evaluate projects by company managements and equities by investment analysts is harmful both to capital allocation decisions and the appraisal of company valuations. Seymour Schulich, founder of Franco-Nevada Mining Corporation and one of the keenest minds in the mining industry, explained this to me over 20 years ago during a site visit. At the June 15 RBC Capital Markets Global Mining & Materials Conference, mining impresario Robert Friedland describes DCF valuation methodology as “idiotic”: “The management of these banks that allow analysts to create these absurd models, they should just change their minds. Because the real-world value of a Tier 1 mine is much more than an NPV model, and NPV modeling is not the only way to model a mine.” DCF overvalues a dollar of cash generation today relative to the dollars generated 10 years in the future. Such Mr. Magoo-like near-sighted thinking also distorts analysis by managements and investment bankers of prospective M&A transactions.
Overweighting the consideration of near-term cash flows against the possibilities for game-changing future cash flows is, in many cases, just an indication of ground-hugging (CYA) risk adversity and a recipe for corporate shrinkage. Producers have little appetite to displease shareholders by acquiring non-producing assets. This has resulted in a wide disparity between large- and small-cap gold mining equity valuations.
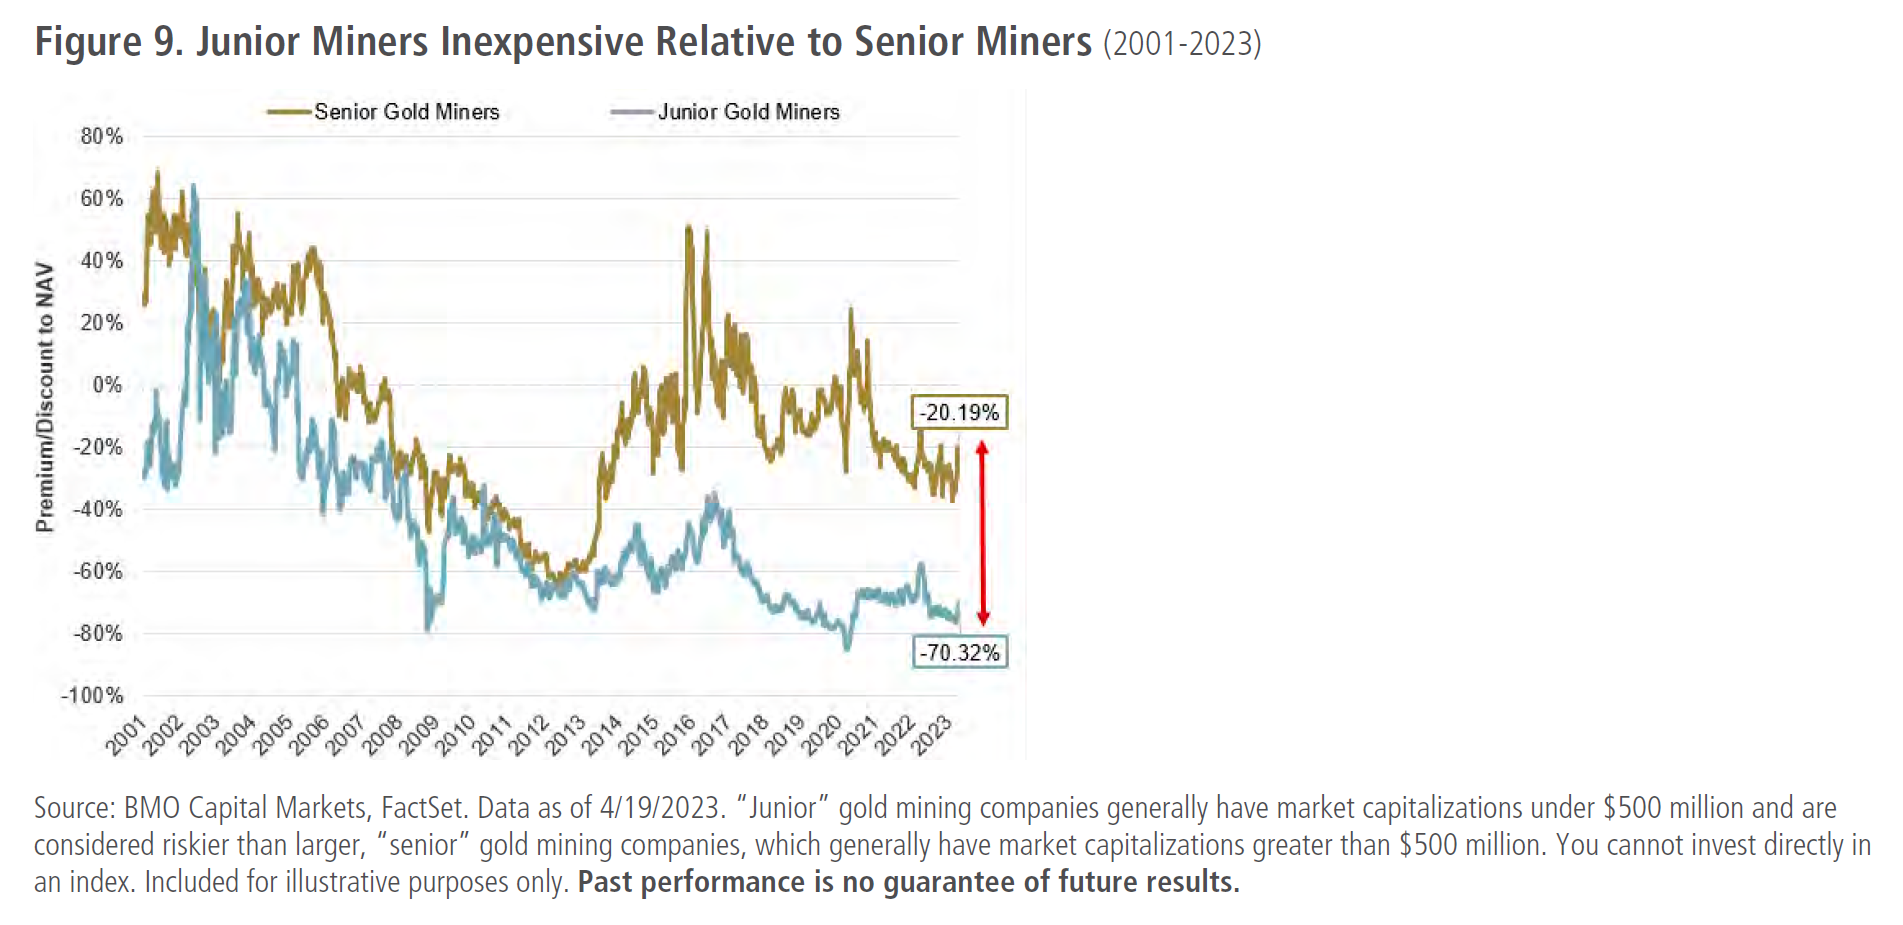
Exploration and development stage gold mining companies routinely trade at extreme discounts to their producing counterparts. Speaking as experienced (and appropriately bruised) investors in precious metals mining equities, we have seen cycles like this play out before. Mid- to smaller-cap equities can be highly sensitive to the dynamic of value creation through the process of discovery and mine-building. On the other hand, that dynamic rarely moves the needle in the larger-cap sector. While the potential for mean regression exists across the sector, we believe the opportunity is greatest among mid- to smallcap securities.
Potential for Mean Regression Trade
Gold is considered a safe haven asset; it may protect capital but does not provide investment opportunity. By contrast, gold mining stocks are not considered safe assets as they incorporate risk, but they offer the potential for building significant capital. Gold and related mining stocks are joined at the hip. One cannot invest in the latter without having a point of view on the former. The key judgment is whether the metal is correctly priced in nominal currency terms. That requires judgment on the quality of the currency in which it is priced. Gold has risen against all paper currencies, including the USD. We believe the notion that a strong U.S. dollar is negative for gold is laughable. While the U.S. dollar might look “strong” against other paper currencies from time to time, relative performance does not equate to inherent strength. The dollar has been persistently weak against gold since 1971. Since the last remnant of gold backing was removed by Nixon over 50 years ago, there has been no such thing as an inherently strong dollar on a sustained basis.
Gold mining equities have two things going for them. First, they have quietly become very cheap stocks, are seriously unloved and represent a contrarian’s delight. Second, they offer low-risk exposure to what we regard as the very likely prospect of the continuing and possibly accelerating downgrade of the USD. A reversion to inflation-adjusted 2011 levels would see the GDX and GDXJ rally over 110% and 300% respectively. Our expectation is for small and mid-cap companies to rally harder than their larger-cap peers.
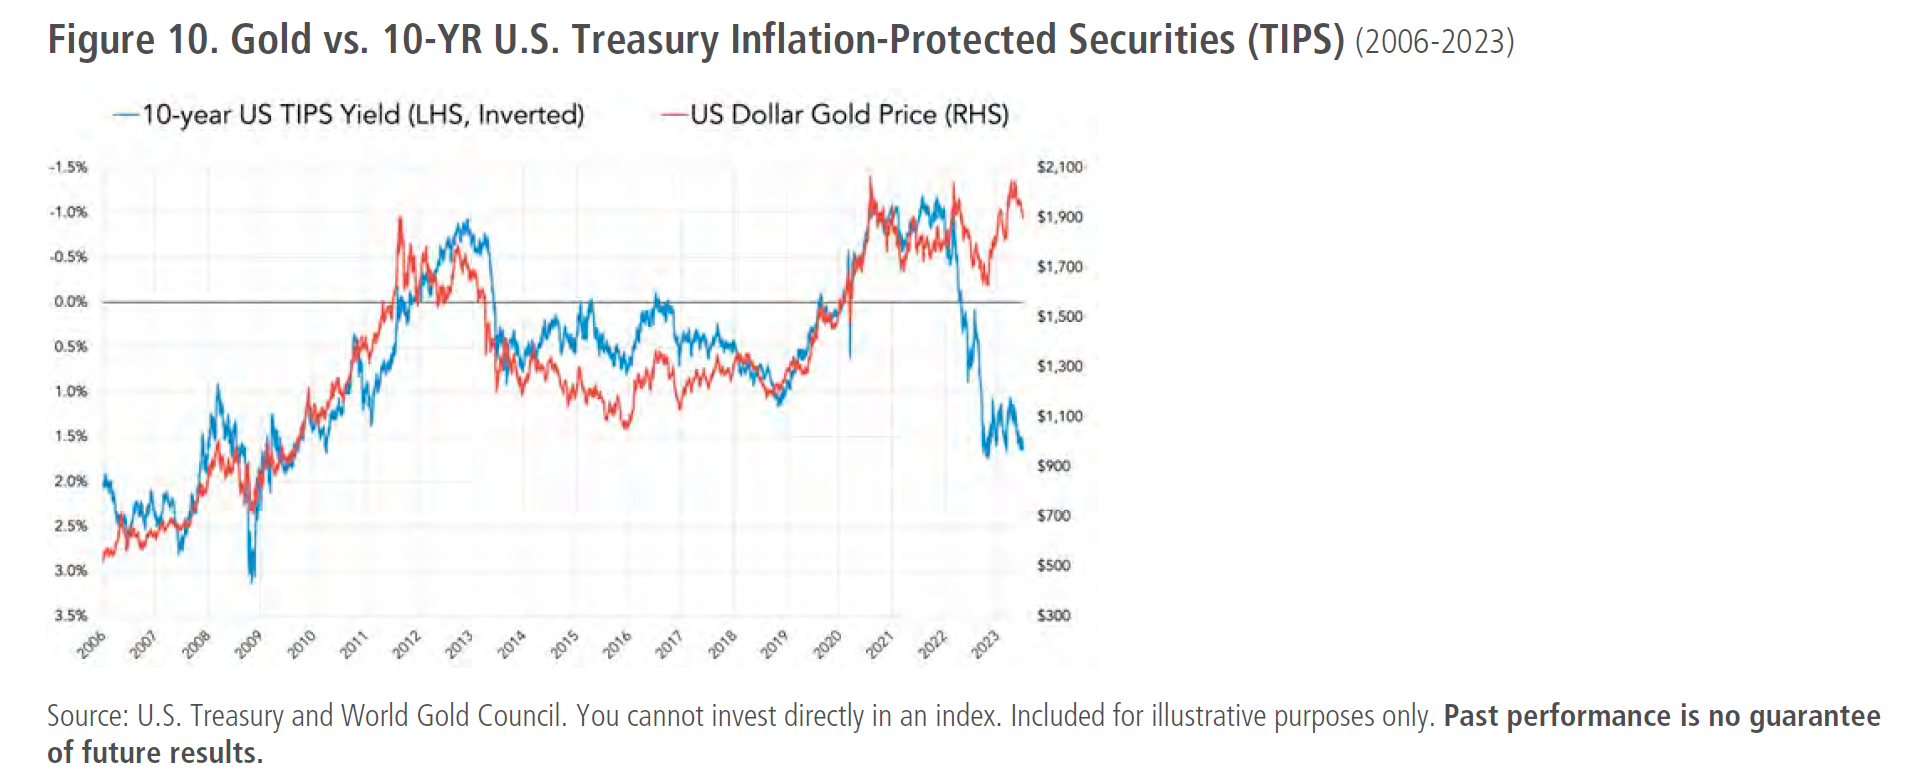
Uncritical acceptance of the pricing of real assets in nominal dollars signifies the nearly universal brainwashing of establishment economists, investment thought leaders and policymakers. The Consumer Price Index (CPI) reported monthly is widely accepted as an accurate gauge of inflation and, by inference, the integrity of the U.S. dollar as a store of value. Since 1983, the Bureau of Labor Statistics, which oversees the calculation of the CPI index, has “updated” its methodology 25 times. (Grant’s 1/27/23-Inflation for the Long Run). In 21 out of 25 of those instances, the adjustments caused the reported level of inflation to be lower than previously stated. A sign of market distrust of the CPI inflation measure is the divergence between TIPS (Treasury Inflation-Protection Securities) and the price of gold. Between 2007 and 2021, the correlation between TIPS and the price of gold was 90%. The breakdown is depicted in Figure 10.
It is in the self-interest of the political and financial establishment to portray a sanguine economic picture. Years of “sly cheating” that “continues apace” by the makers of monetary and fiscal policy (Grant’s Interest Rate Observer, 6/2/23) condition the investment consensus into uncritical acceptance of an alternate reality. Economic indicators are routinely tweaked and massaged for mass consumption. For example, both Non-Farm Payrolls and retail sales reports, both widely followed and capable of moving markets, are frequently distorted, whenever necessary, by seasonal adjustment factors arbitrarily tweaked for cosmetic purposes. The line between propagators and consumers of misinformation is indistinguishable. Perpetuation of distorted information is mutually convenient.
Issuance of new rounds of government debt seems overly dependent on the suspension of critical thinking. With government activity now comprising 27% of GDP, the inability to finance would crush economic activity. Post the recent debt ceiling deal, as noted by Meridian Macro Research, “public debt soared more than $1 trillion, the biggest non-crisis debt monthly increase on record.” Trust that the U.S. dollar will remain a viable global reserve asset is vital. Absent this delusion, damage to U.S. credit would be irreparable.
It would seem that the gravitational limits of credulity are being probed. Based on our expectation for spreading skepticism, we believe that gold will break out to new all-time highs in inflation-adjusted terms. That would translate into a gain of roughly 30% in nominal dollars, or $2,500-$2,600, simply to square with the fundamental forces that have been gathering since the previous nominal peak of $1,920 a decade ago. Should gold do so, the death of the U.S. dollar as a safe asset would become manifest. Mean regression based on our analysis could equate to 50% to 150% upside for precious metals equities versus gold itself with smaller, more overlooked stocks having the potential to benefit by an even larger degree. Gold mining stocks might once again bask in the sunshine of a decade ago.
Shree Kargutkar
Sprott Asset Management
Sub- Advisor to the Ninepoint Gold & Precious Minerals Fund,
Ninepoint Gold Bullion Fund and the Ninepoint Silver Fund
1All Ninepoint Gold & Precious Minerals Fund returns and fund details are a) based on Series F units; b) net of fees; c) annualized if period is greater than one year; d) as at June 30, 2023. The index is 100% S&P/TSX Global Gold Total Return Index and is computed by Ninepoint Partners LP based on publicly available index information. 1All Ninepoint Gold Bullion Fund returns and fund details are a) based on Series F units; b) net of fees; c) annualized if period is greater than one year; d) as at June 30, 2023. The index is 100% Global Spot (CAD) Index and is computed by Ninepoint Partners LP based on publicly available index information. 1All Ninepoint Silver Bullion Fund returns and fund details are a) based on Series F units; b) net of fees; c) annualized if period is greater than one year; d) as at June 30, 2023;. The index is 100% Silver Spot (CAD) Index and is computed by Ninepoint Partners LP based on publicly available index information.
The risks associated with investing in a Fund depend on the securities and assets in which the Fund invests, based upon the Fund’s particular objectives. There is no assurance that any Fund will achieve its investment objective, and its net asset value, yield and investment return will fluctuate from time to time with market conditions. There is no guarantee that the full amount of your original investment in a Fund will be returned to you. The Funds are not insured by the Canada Deposit Insurance Corporation or any other government deposit insurer. Please read a Fund’s prospectus or offering memorandum before investing.
Ninepoint Partners LP is the investment manager to the Ninepoint Funds (collectively, the “Funds”). Commissions, trailing commissions, management fees, performance fees (if any), other charges and expenses all may be associated with mutual fund investments. Please read the prospectus carefully before investing. The indicated rate of return for series F units of the Fund for the period ended June 30, 2023 is based on the historical annual compounded total return including changes in unit value and reinvestment of all distributions and does not take into account sales, redemption, distribution or optional charges or income taxes payable by any unitholder that would have reduced returns. Mutual funds are not guaranteed, their values change frequently and past performance may not be repeated. The information contained herein does not constitute an offer or solicitation by anyone in the United States or in any other jurisdiction in which such an offer or solicitation is not authorized or to any person to whom it is unlawful to make such an offer or solicitation. Prospective investors who are not resident in Canada should contact their financial advisor to determine whether securities of the Fund may be lawfully sold in their jurisdiction.
The opinions, estimates and projections (“information”) contained within this report are solely those of Ninepoint Partners LP and are subject to change without notice. Ninepoint Partners makes every effort to ensure that the information has been derived from sources believed to be reliable and accurate. However, Ninepoint Partners assumes no responsibility for any losses or damages, whether direct or indirect, which arise out of the use of this information. Ninepoint Partners is not under any obligation to update or keep current the information contained herein. The information should not be regarded by recipients as a substitute for the exercise of their own judgment. Please contact your own personal advisor on your particular circumstances. Views expressed regarding a particular company, security, industry or market sector should not be considered an indication of trading intent of any investment funds managed by Ninepoint Partners. Any reference to a particular company is for illustrative purposes only and should not to be considered as investment advice or a recommendation to buy or sell nor should it be considered as an indication of how the portfolio of any investment fund managed by Ninepoint Partners is or will be invested. Ninepoint Partners LP and/or its affiliates may collectively beneficially own/control 1% or more of any class of the equity securities of the issuers mentioned in this report. Ninepoint Partners LP and/or its affiliates may hold short position in any class of the equity securities of the issuers mentioned in this report. During the preceding 12 months, Ninepoint Partners LP and/or its affiliates may have received remuneration other than normal course investment advisory or trade execution services from the issuers mentioned in this report.
Views expressed regarding a particular company, security, industry or market sector should not be considered an indication of trading intent of any investment funds managed by Ninepoint Partners LP. These views are not to be considered as investment advice nor should they be considered a recommendation to buy or sell.
Ninepoint Partners LP: Toll Free: 1.866.299.9906. DEALER SERVICES: CIBC Mellon GSSC Record Keeping Services: Toll Free: 1.877.358.0540
Investment Team

Related Funds
Toronto, Ontario M5J 2J1 Canada