Ninepoint Global Real Estate Fund
September 2023 Commentary
Summary
- Ninepoint Global Real Estate Fund had a YTD return of -5.58% as of September 30, compared to the MSCI World IMI Core Real Estate Index, which had a YTD return of -4.29%.
- In September, the Fund had a negative monthly return of -6.17%, while the Index generated a total return of -6.16%.
- September saw a decline in stock markets, with S&P 500 TR dropping by -4.8% and NASDAQ Composite by -5.8%, primarily due to a spike in the US 10-year bond yield to 4.69%, leading to P/E multiple compression.
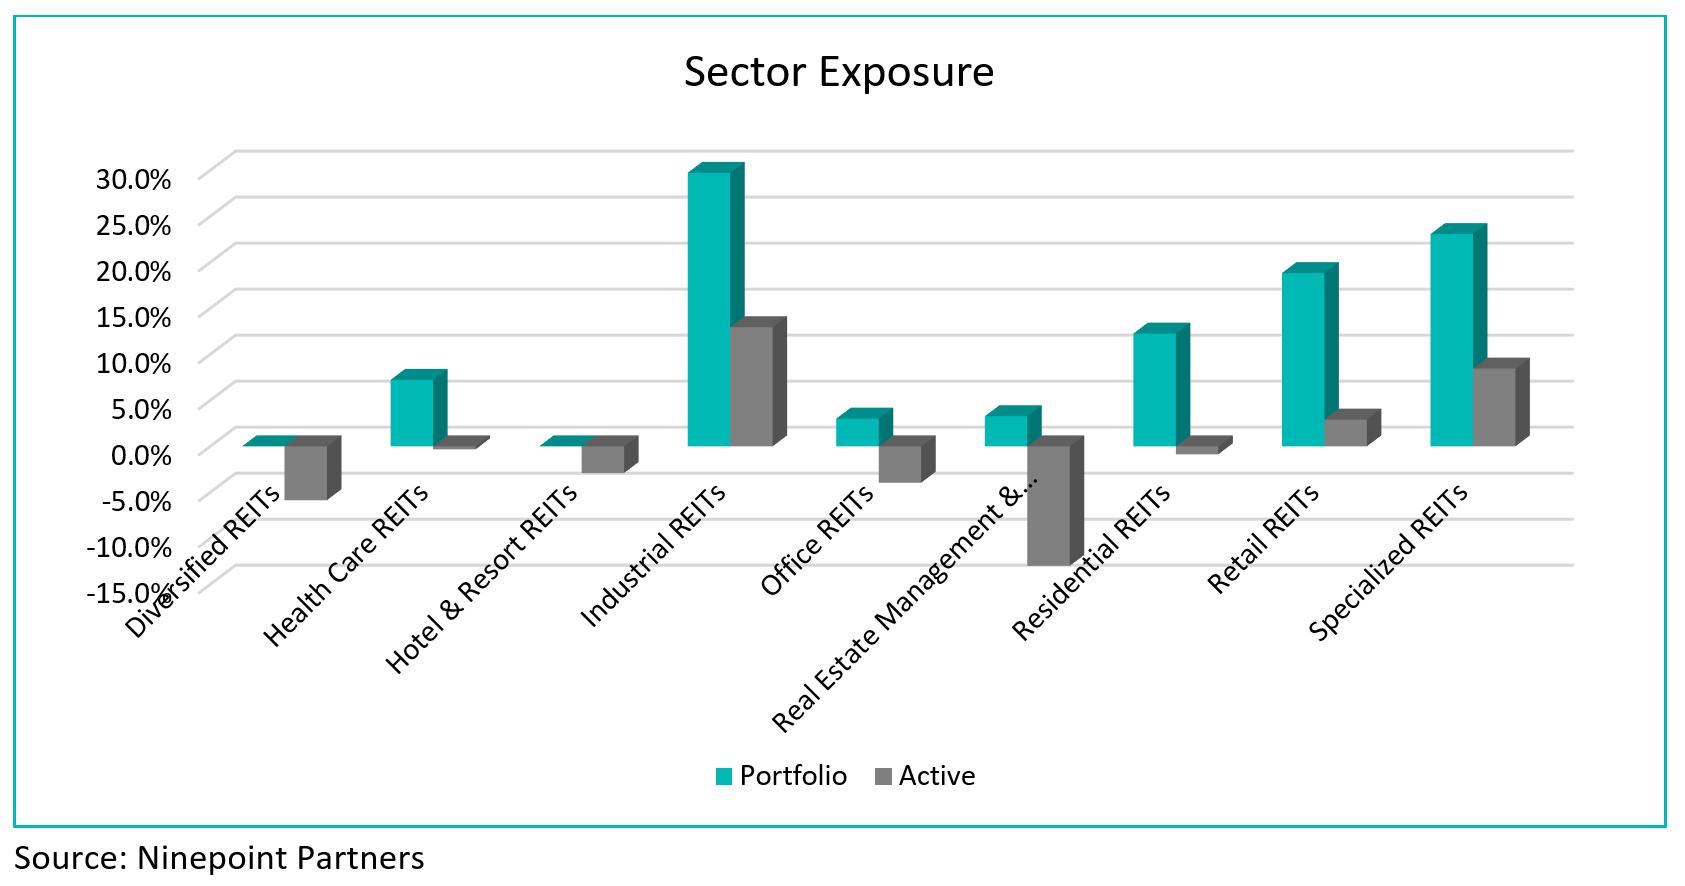
- The Energy sector was the only gainer during the month, while interest rate-sensitive sectors like Real Estate and Utilities underperformed. The fund is currently overweight Industrial REITs, Specialized REITs, and Retail REITs while underweight Real Estate Management & Development, Diversified REITs, and Office REITs.
- Macroeconomic variables, such as GDP growth, unemployment, and inflation, remain relatively stable despite market turbulence.
- Investors are looking to the Q3 earnings season for clues, with consensus estimates suggesting a potential return to positive earnings growth.
- The fund was concentrated in 28 positions. Over the prior fiscal year, 18out of our 28 holdings have announced a dividend increase, with an average hike of 11.3% (median hike of 3.0%).
Monthly Update
Year-to-date to September 30, the Ninepoint Global Real Estate Fund generated a total return of -5.58% compared to the MSCI World IMI Core Real Estate Index, which generated a total return of -4.29%. For the month, the Fund generated a total return of -6.17% while the Index generated a total return of -6.16%.
Ninepoint Global Real Estate Fund - Compounded Returns¹ As of September 30, 2023 (Series F NPP132) | Inception Date: August 5, 2015
| 1M | YTD | 3M | 6M | 1YR | 3YR | 5YR | Inception | |
| Fund | -6.2% | -5.6% | -6.5% | -9.6% | -3.9% | -1.0% | 2.4% | 5.1% |
| MSCI World IMI Core Real Estate NR (CAD) | -6.2% | -4.3% | -3.3% | -4.9% | 1.0% | 1.0% | 0.0% | 1.6% |
After a mildly disappointing month in August for investors, September lived up to its nasty reputation. The S&P 500 TR dropped -4.8% and the NASDAQ Composite plunged -5.8%, led by declines in the year-to-date winners. The Energy sector was the sole gainer during the month, while the Information Technology and Consumer Discretionary sectors were notably weak. Like August, the primary culprit during the month of September was a spike in the US 10-year bond yield to 4.69% (reaching a new 15-year high), which is generally correlated to P/E multiple compression. Unsurprisingly, traditionally interest rate-sensitive sectors underperformed, with the Real Estate and Utilities sectors posting very disappointing returns.
In last month’s commentary, we discussed some of the drivers behind the sharp move higher in yields around the world, which included the announcement from the Bank of Japan shifting monetary policy away from strict yield curve control, the Fitch Ratings downgrade of US sovereign debt from AAA to AA+ and the tough talk on inflation from Chairman Powell and various other Fed speakers. In September, we could add the fear over the looming threat of a US government shutdown (which thankfully was pushed out by at least forty-five days with a last-minute stopgap bill) and the move in the price of crude oil above $90 per barrel (which fueled concerns of resurgent inflation). But with growth remaining resilient (the third estimate of US Q2 GDP came in at 2.1%), unemployment staying relatively low and stable (at 3.8% in August) and the most recent PCE (the Fed’s key measure of inflation) coming in slightly cooler than expected (at 0.4% MoM versus 0.5% expected and Core PCE at 0.1% MoM versus 0.2% expected), the recent move in rates looks way overdone.
Outside of macroeconomic variables, the outlook for the remainder of the year will likely depend on earnings, and investors will soon turn their attention to the Q3 reporting season. In Q2, the operating and financial results were much better than originally feared, with earnings coming in at -4.1%, compared to initial expectations for a decline of somewhere between -8% and -9%, according to FactSet. Current consensus estimates imply a decline of only -0.1%, marking the fourth straight quarter of negative year-over-year growth but a return to positive earnings growth is within the realm of possibility. In fact, eight out of the eleven S&P 500 sectors are expected to report positive year-over-year earnings growth and ranked in order, including the Communication, Consumer Discretionary, Utilities, Financials, Industrials, Information Technology, Real Estate and Consumer Staples sectors. In this environment, we are searching for companies that have been able to post solid earnings growth but still trade at acceptable valuations. Dividend growth companies and real asset strategies look poised to benefit from any rotation out of the high-multiple, technology winners of 2023 should interest rates stabilize.
In an environment of moderating inflation but slowing economic growth through 2023 and into 2024, the most important drivers of investment performance will likely be valuation, balance sheet strength and the ability to consistently generate cash flow and earnings. As interest rates stabilize, a rotation into high quality, dividend growers would result in better relative performance from our strategies going forward. In keeping with our mandates, we are concentrating our efforts on free cash flow positive, high quality, dividend growth companies and real asset investments given our positive assessment of the risk/reward outlook over the next two to three years.
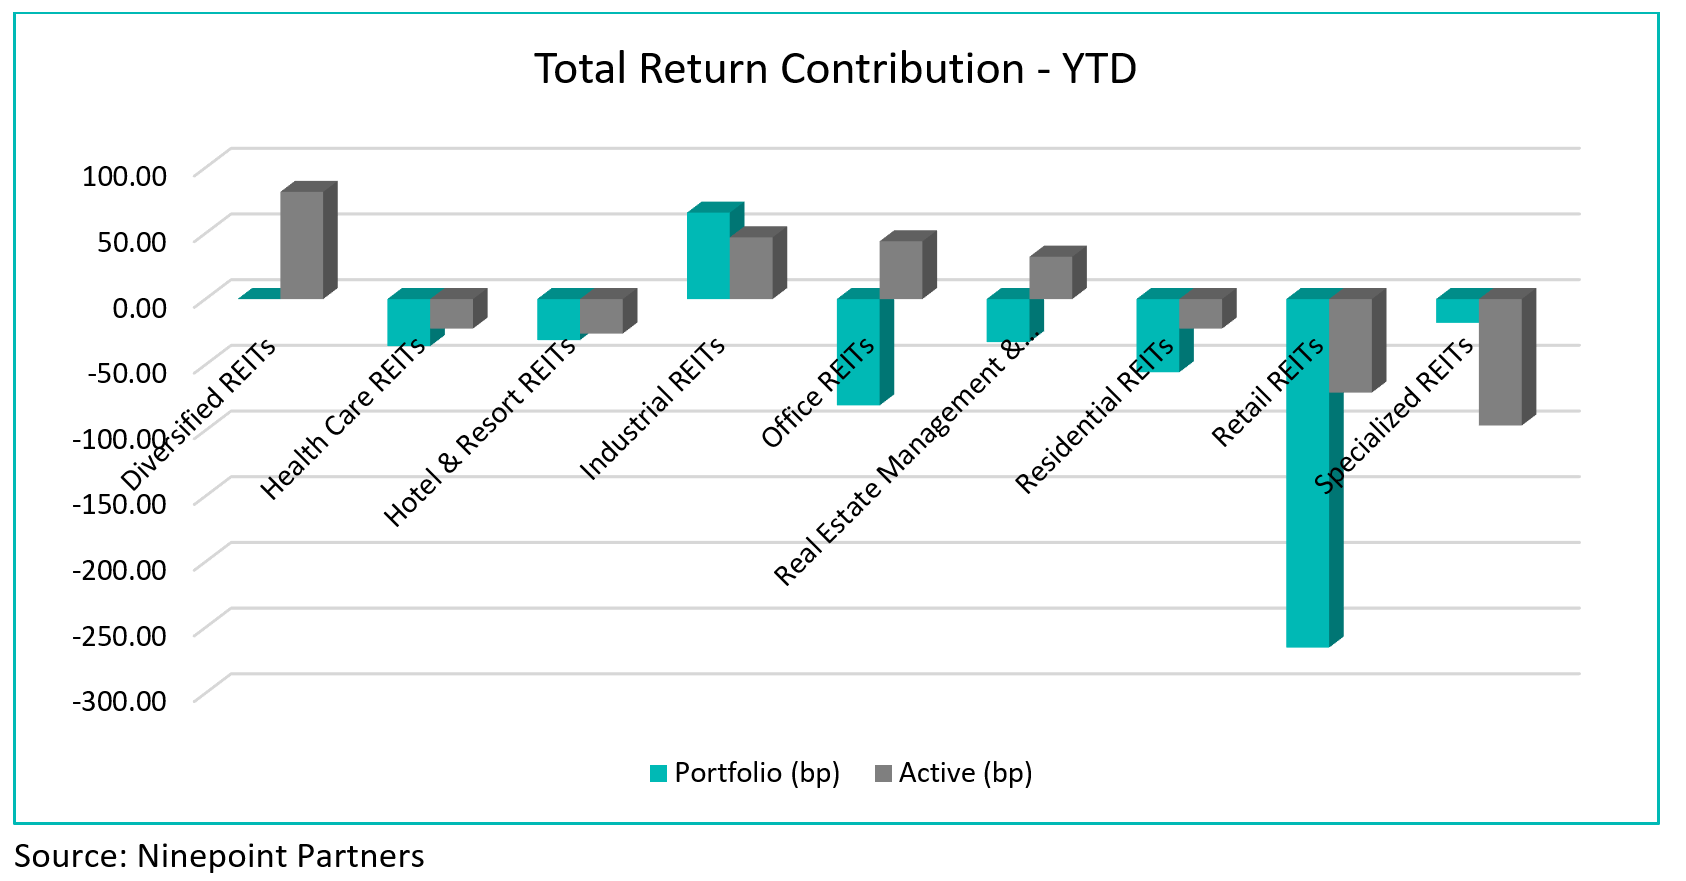
Top contributors to the year-to-date performance of the Ninepoint Global Real Estate Fund by sub-industry included only Industrial REITs (+66 bps), while top detractors by sub-industry included Retail REITs (-265 bps), Office REITs (-81 bps) and Residential REITs (-56 bps) on an absolute basis.
On a relative basis, positive return contributions from the Diversified REITs (+82 bps), Industrial REITs (+47 bps) and Office REITs (+44 bps) sub-industries were offset by negative contributions from the Specialized REITs (-96 bps), Retail REITs (-71 bps) and Hotel & Resort REITs (-26 bps) sub-industries.
 We are currently overweight Industrial REITs, Specialized REITs, and Retail REITs while underweight Real Estate Management & Development, Diversified REITs, and Office REITs. With the probability of a future interest rate hike below 50% for each of the two remaining FOMC meetings in 2023 according to Refinitiv, interest rate hikes are likely done for the cycle. While we are cognizant of the lagged impact of 525 basis points of monetary tightening since March 2022, we think the rapid spike in the US 10-year bond yields is overdone. We remain focused on high quality, financially strong REITs that have demonstrated the ability to consistently generate revenue and cash flow growth through the cycle.
The Ninepoint Global Real Estate Fund was concentrated in 28 positions as at September 30, 2023 with the top 10 holdings accounting for approximately 40.8% of the fund. Over the prior fiscal year, 18 out of our 28 holdings have announced a dividend increase, with an average hike of 11.3% (median hike of 3.0%). Using a total real estate approach, we will continue to apply a disciplined investment process, balancing valuation, growth, and yield in an effort to generate solid risk-adjusted returns.
Jeffrey Sayer, CFA
Ninepoint Partners
Effective February 7, 2017 the Sprott Global REIT & Property Equity Fund’s name was changed to Sprott Global Real Estate Fund, subsequently on August 1, 2017 becoming Ninepoint Global Real Estate Fund.
1All returns and fund details are a) based on Series F units; b) net of fees; c) annualized if period is greater than one year; d) as at September 30, 2023; e) 2015 annual returns are from 08/04/15 to 12/31/15. The index is 100% MSCI World IMI Core Real Estate NR (CAD) and is computed by Ninepoint Partners LP based on publicly available index information.
The Fund is generally exposed to the following risks. See the Simplified Prospectus of the Fund for a description of these risks: capital depletion risk, concentration risk, credit risk, currency risk, cybersecurity risk; derivatives risk, emerging markets risk, equity real estate investment trust (REIT) risk, exchange traded funds risk, foreign investment risk, income trust risk, inflation risk, interest rate risk, liquidity risk, market risk, preferred stock risk; real estate risk; regulatory risk; securities lending, repurchase and reverse purchase transaction risk; series risk; short selling risk; specific issuer risk; substantial securityholfer risk; tax risk.
Ninepoint Partners LP is the investment manager to the Ninepoint Funds (collectively, the “Funds”). Commissions, trailing commissions, management fees, performance fees (if any), and other expenses all may be associated with investing in the Funds. Please read the prospectus carefully before investing. The indicated rate of return for series F units of the Fund for the period ended September 30, 2023 is based on the historical annual compounded total return including changes in unit value and reinvestment of all distributions and does not take into account sales, redemption, distribution or optional charges or income taxes payable by any unitholder that would have reduced returns. Mutual funds are not guaranteed, their values change frequently and past performance may not be repeated. The information contained herein does not constitute an offer or solicitation by anyone in the United States or in any other jurisdiction in which such an offer or solicitation is not authorized or to any person to whom it is unlawful to make such an offer or solicitation. Prospective investors who are not resident in Canada should contact their financial advisor to determine whether securities of the Fund may be lawfully sold in their jurisdiction.
The opinions, estimates and projections (“information”) contained within this report are solely those of Ninepoint Partners LP and are subject to change without notice. Ninepoint Partners makes every effort to ensure that the information has been derived from sources believed to be reliable and accurate. However, Ninepoint Partners assumes no responsibility for any losses or damages, whether direct or indirect, which arise out of the use of this information. Ninepoint Partners is not under any obligation to update or keep current the information contained herein. The information should not be regarded by recipients as a substitute for the exercise of their own judgment. Please contact your own personal advisor on your particular circumstances. Views expressed regarding a particular company, security, industry or market sector should not be considered an indication of trading intent of any investment funds managed by Ninepoint Partners. Any reference to a particular company is for illustrative purposes only and should not to be considered as investment advice or a recommendation to buy or sell nor should it be considered as an indication of how the portfolio of any investment fund managed by Ninepoint Partners is or will be invested. Ninepoint Partners and/or its affiliates may collectively beneficially own/control 1% or more of any class of the equity securities of the issuers mentioned in this report. Ninepoint Partners and/or its affiliates may hold short position in any class of the equity securities of the issuers mentioned in this report. During the preceding 12 months, Ninepoint Partners and/or its affiliates may have received remuneration other than normal course investment advisory or trade execution services from the issuers mentioned in this report.
Ninepoint Partners LP: Toll Free: 1.866.299.9906. DEALER SERVICES: CIBC Mellon GSSC Record Keeping Services: Toll Free: 1.877.358.0540

Related Funds
Historical Commentary
- Global Real Estate Fund 12/2023
- Global Real Estate Fund 11/2023
- Global Real Estate Fund 10/2023
- Global Real Estate Fund 08/2023
- Global Real Estate Fund 07/2023
- Global Real Estate Fund 06/2023
- Jeff Sayer - H1 2023 Market Review and Outlook - Real Asset Strategies
- Global Real Estate Fund 05/2023
- Global Real Estate Fund 04/2023
- Global Real Estate Fund 03/2023
- Global Real Estate Fund 02/2023
- Global Real Estate Fund 01/2023
Toronto, Ontario M5J 2J1 Canada