Ninepoint Global Real Estate Fund
October 2023 Commentary
Summary
- Ninepoint Global Real Estate Fund had a YTD return of -8.85% up to October 31, compared to the MSCI World IMI Core Real Estate Index with a total return of -6.39%.
- In October, the Fund generated a total return of -3.47%, while the Index had a return of -2.20%.
- The year experienced weak seasonality, with disappointing performance in August, a challenging September, and an underwhelming October. However, relief was provided after the October 31 to November 1 Fed meeting, which indicated a pause in the tightening phase.
- Earnings reports in October were better than expected, with a blended year-over-year earnings growth rate of 3.7%. Several sectors are expected to report positive year-over-year earnings growth, ending the earnings recession.
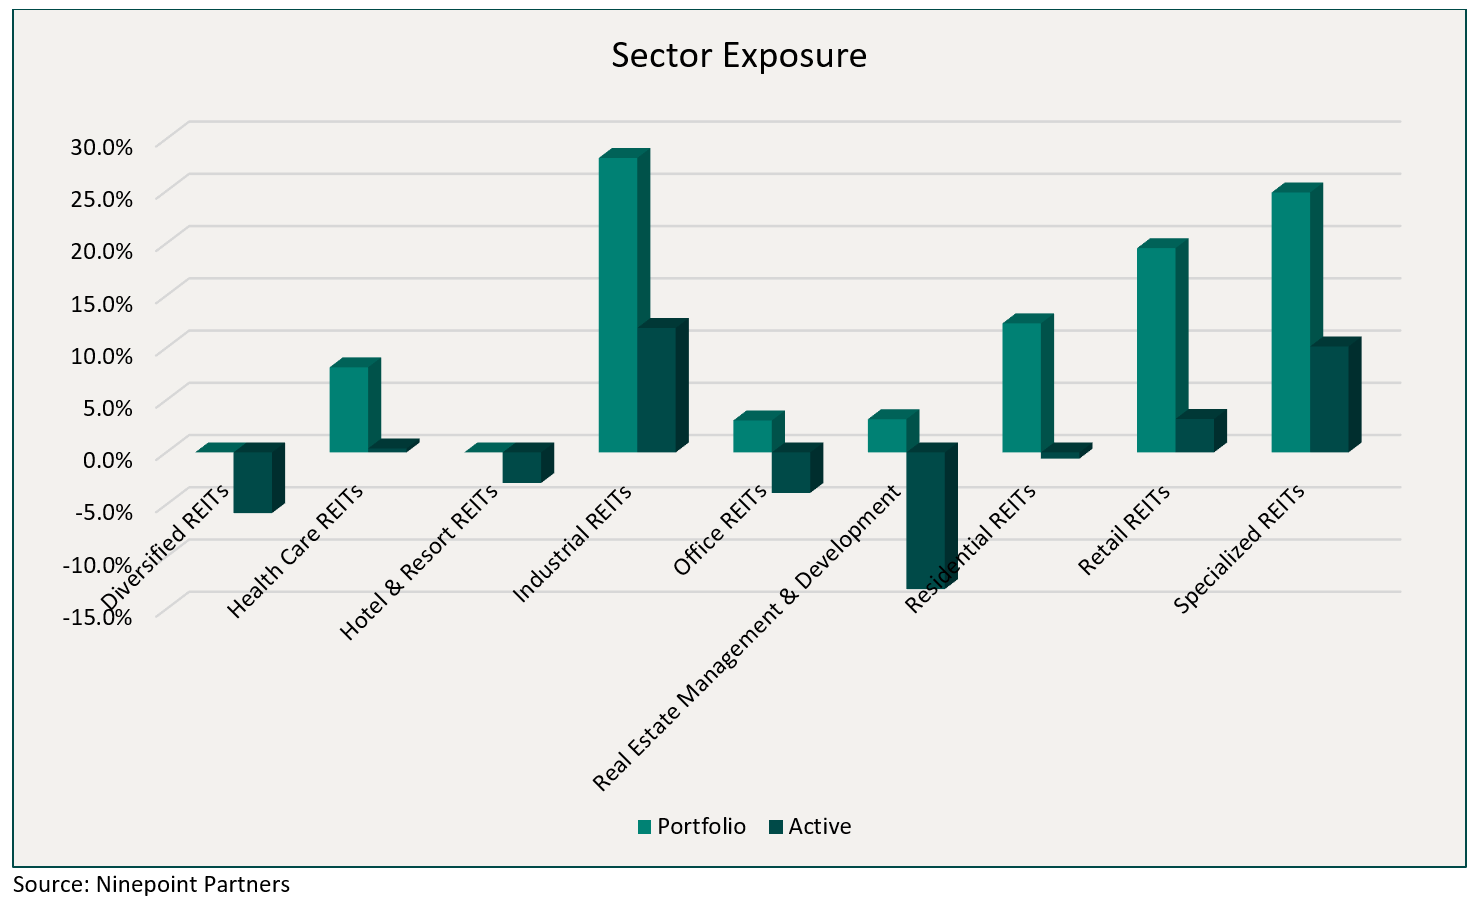
- The Fund is currently overweight Industrial REITs, Specialized REITs, and Retail REITs while underweight Real Estate Management & Development, Diversified REITs, and Office REITs.
- The fund was concentrated in 28 positions, with the top 10 holdings accounting for approximately 42.7% of the fund. Over the prior fiscal year, 18 out of our 28 holdings have announced a dividend increase, with an average hike of 11.3% (median hike of 3.0%).
Monthly Update
Year-to-date to October 31, the Ninepoint Global Real Estate Fund generated a total return of -8.85% compared to the MSCI World IMI Core Real Estate Index, which generated a total return of -6.39%. For the month, the Fund generated a total return of -3.47% while the Index generated a total return of -2.20%.
Ninepoint Global Real Estate Fund - Compounded Returns¹ As of October 31, 2023 (Series F NPP132) | Inception Date: August 5, 2015
| 1M | YTD | 3M | 6M | 1YR | 3YR | 5YR | Inception | |
| Fund | -3.5% | -8.9% | -10.4% | -13.2% | -8.5% | -0.9% | 2.4% | 4.6% |
| MSCI World IMI Core Real Estate NR (CAD) | -2.2% | -6.4% | -8.6% | -8.9% | -3.4% | 1.4% | 0.1% | 1.4% |
Weak seasonality seems to have played out once again in 2023. The month of August was mildly disappointing, September was pretty nasty, and October wasn’t that great either. However, the October 31 to November 1 Fed meeting thankfully provided some relief to bonds, equities, and most other asset classes. After last hiking in July, members of the FOMC committee voted to hold rates steady at 5.25% to 5.50% and Chairman Powell’s press conference essentially confirmed that the tightening phase of the cycle is now done. Importantly, we believe that the Fed was satisfied with the idea that the final spike in the US 10-year bond yield to 5.0% has effectively tightened financial conditions to a sufficient degree. We had previously identified the rate spike as the primary culprit of weakness across various financial asset classes and because peak rates have likely been reached, short sellers covered positions and dip buyers stepped in aggressively.
As expected, after 525 bps of tightening since March 2022, the economic data is slowing but remains relatively resilient. Specifically, the October PMI data was consistent with a slowdown as the ISM Manufacturing PMI remained in contractionary territory at 46.7% and the ISM Services PMI registered only 51.8%, down from September’s reading of 53.6%. Further, October’s nonfarm payroll report increased by only 150,000 jobs and the unemployment rate ticked up to 3.9%. But signs that fear had begun to dissipate were evident in the pullback in the price of crude oil and the pause in the rapid appreciation of the safe-haven US Dollar. Incorporating all the pieces of information into future projections, the forward curve is currently indicating almost no chance of another rate hike through January 2024, and almost four rate cuts in 2024. Perhaps 100 bps of anticipated easing in 2024 suggests an incorrectly dovish scenario (growth would likely have to weaken dramatically for that amount of Fed easing, which wouldn’t be good) but the odds of a soft landing are improving.
Beyond our obsession with macroeconomic variables, investors have faced an onslaught of earnings reports during October. With 81% of the S&P 500 companies having reported actual results, the blended year-over-year earnings growth rate is 3.7%, an improvement over prior expectations of a slight decline. If earnings can remain positive over the remainder of the reporting season, it would mark the first quarter of growth since Q3 2022. An end to the earnings recession would be welcome news, and eight out of the eleven S&P 500 sectors are expected to report positive year-over-year earnings growth. Ranked in order, they include the Communication, Consumer Discretionary, Financials, Information Technology, Utilities, Industrials, Real Estate and Consumer Staples sectors. As always, we are continually searching for companies that have been able to post solid earnings growth but still trade at acceptable valuations.
In an environment of moderating inflation but slowing economic growth through the balance of 2023 and into 2024, the most important drivers of investment performance will likely be valuation, balance sheet strength and the ability to consistently generate cash flow and earnings. In keeping with our mandates, we are concentrating our research efforts on high quality, dividend growth companies and real asset investments given our positive assessment of the risk/reward outlook over the next phase of the cycle. As interest rates stabilize around fifteen year-highs and capital becomes more expensive, these types of investments look poised to benefit from a rotation out of the high-multiple, technology winners of 2023.
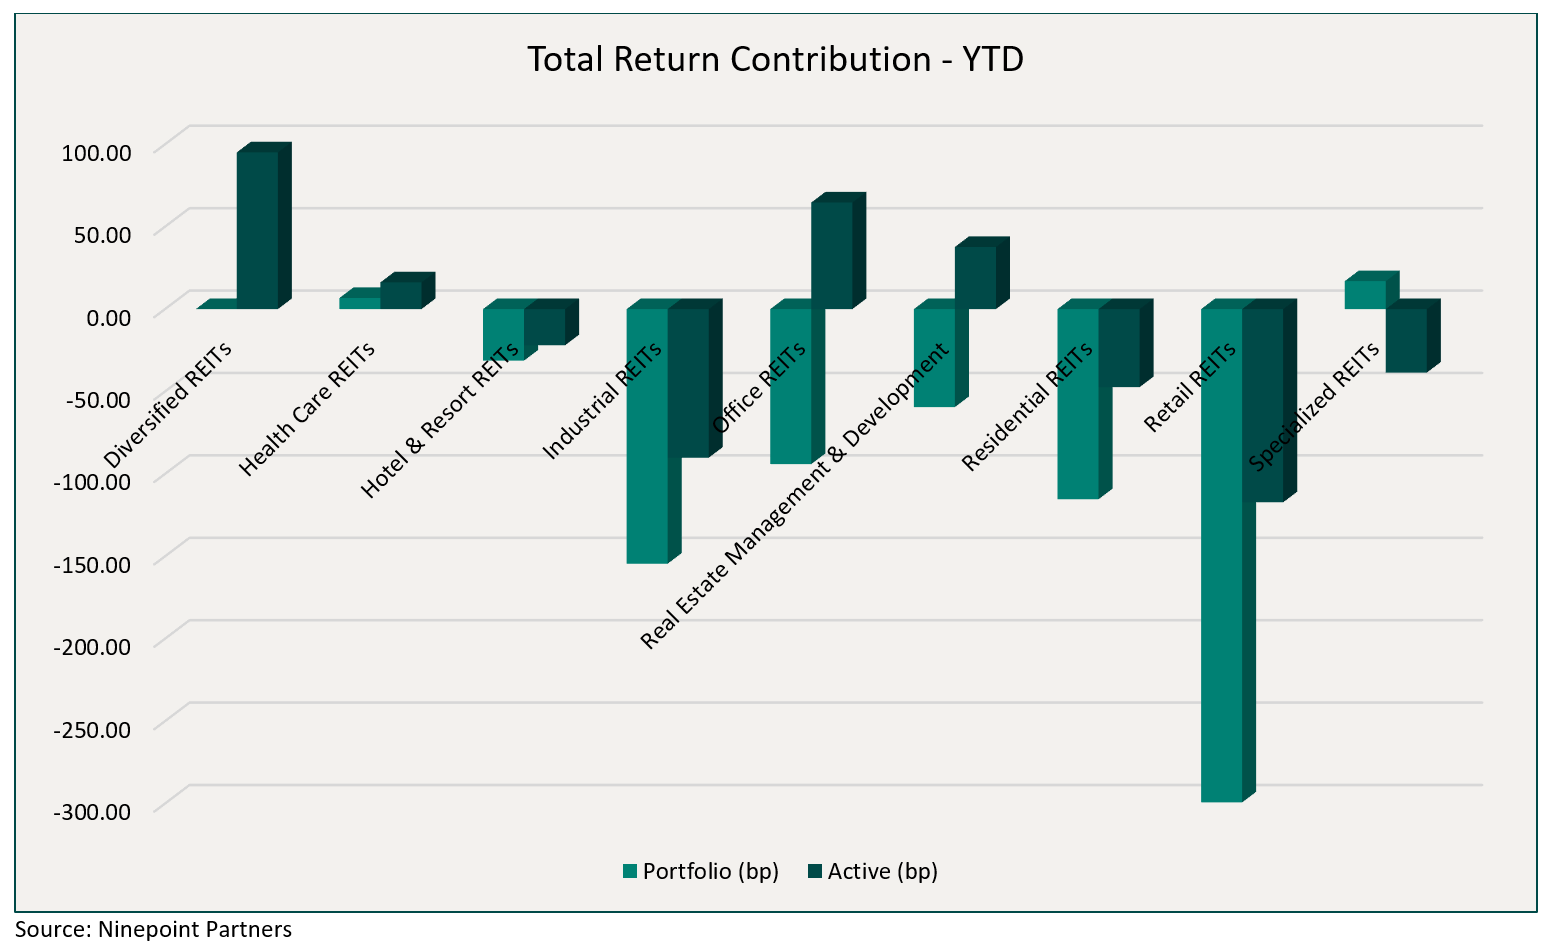
Top contributors to the year-to-date performance of the Ninepoint Global Real Estate Fund by sub-industry included Specialized REITs (+17 bps) and Health Care REITs (+7 bps), while top detractors by sub-industry included Retail REITs (-299 bps), Industrial REITs (-154 bps) and Residential REITs (-115 bps) on an absolute basis.
On a relative basis, positive return contributions from the Diversified REITs (+95 bps), Office REITs (+65 bps) and Real Estate Management & Development (+38 bps) sub-industries were offset by negative contributions from the Retail REITs (-117 bps), Industrial REITs (-90 bps) and Residential REITs (-47 bps) sub-industries.
We are currently overweight Industrial REITs, Specialized REITs, and Retail REITs while underweight Real Estate Management & Development, Diversified REITs, and Office REITs. While the lagged impact of monetary tightening is still working its way through the economy, we believe that the threat of much higher interest rates has passed. We remain focused on high quality, dividend payers that have demonstrated the ability to consistently generate revenue and earnings growth through the cycle.
The Ninepoint Global Real Estate Fund was concentrated in 28 positions as at October 31, 2023 with the top 10 holdings accounting for approximately 42.7% of the fund. Over the prior fiscal year, 18 out of our 28 holdings have announced a dividend increase, with an average hike of 11.3% (median hike of 3.0%). Using a total real estate approach, we will continue to apply a disciplined investment process, balancing valuation, growth, and yield in an effort to generate solid risk-adjusted returns.
Jeffrey Sayer, CFA
Ninepoint Partners
Effective February 7, 2017 the Sprott Global REIT & Property Equity Fund’s name was changed to Sprott Global Real Estate Fund, subsequently on August 1, 2017 becoming Ninepoint Global Real Estate Fund.
1All returns and fund details are a) based on Series F units; b) net of fees; c) annualized if period is greater than one year; d) as at October 31, 2023; e) 2015 annual returns are from 08/04/15 to 12/31/15. The index is 100% MSCI World IMI Core Real Estate NR (CAD) and is computed by Ninepoint Partners LP based on publicly available index information.
The Fund is generally exposed to the following risks. See the Simplified Prospectus of the Fund for a description of these risks: capital depletion risk, concentration risk, credit risk, currency risk, cybersecurity risk; derivatives risk, emerging markets risk, equity real estate investment trust (REIT) risk, exchange traded funds risk, foreign investment risk, income trust risk, inflation risk, interest rate risk, liquidity risk, market risk, preferred stock risk; real estate risk; regulatory risk; securities lending, repurchase and reverse purchase transaction risk; series risk; short selling risk; specific issuer risk; substantial securityholfer risk; tax risk.
Ninepoint Partners LP is the investment manager to the Ninepoint Funds (collectively, the “Funds”). Commissions, trailing commissions, management fees, performance fees (if any), and other expenses all may be associated with investing in the Funds. Please read the prospectus carefully before investing. The indicated rate of return for series F units of the Fund for the period ended October 31, 2023 is based on the historical annual compounded total return including changes in unit value and reinvestment of all distributions and does not take into account sales, redemption, distribution or optional charges or income taxes payable by any unitholder that would have reduced returns. Mutual funds are not guaranteed, their values change frequently and past performance may not be repeated. The information contained herein does not constitute an offer or solicitation by anyone in the United States or in any other jurisdiction in which such an offer or solicitation is not authorized or to any person to whom it is unlawful to make such an offer or solicitation. Prospective investors who are not resident in Canada should contact their financial advisor to determine whether securities of the Fund may be lawfully sold in their jurisdiction.
The opinions, estimates and projections (“information”) contained within this report are solely those of Ninepoint Partners LP and are subject to change without notice. Ninepoint Partners makes every effort to ensure that the information has been derived from sources believed to be reliable and accurate. However, Ninepoint Partners assumes no responsibility for any losses or damages, whether direct or indirect, which arise out of the use of this information. Ninepoint Partners is not under any obligation to update or keep current the information contained herein. The information should not be regarded by recipients as a substitute for the exercise of their own judgment. Please contact your own personal advisor on your particular circumstances. Views expressed regarding a particular company, security, industry or market sector should not be considered an indication of trading intent of any investment funds managed by Ninepoint Partners. Any reference to a particular company is for illustrative purposes only and should not to be considered as investment advice or a recommendation to buy or sell nor should it be considered as an indication of how the portfolio of any investment fund managed by Ninepoint Partners is or will be invested. Ninepoint Partners and/or its affiliates may collectively beneficially own/control 1% or more of any class of the equity securities of the issuers mentioned in this report. Ninepoint Partners and/or its affiliates may hold short position in any class of the equity securities of the issuers mentioned in this report. During the preceding 12 months, Ninepoint Partners and/or its affiliates may have received remuneration other than normal course investment advisory or trade execution services from the issuers mentioned in this report.
Ninepoint Partners LP: Toll Free: 1.866.299.9906. DEALER SERVICES: CIBC Mellon GSSC Record Keeping Services: Toll Free: 1.877.358.0540

Related Funds
Historical Commentary
- Global Real Estate Fund 12/2023
- Global Real Estate Fund 11/2023
- Global Real Estate Fund 09/2023
- Global Real Estate Fund 08/2023
- Global Real Estate Fund 07/2023
- Global Real Estate Fund 06/2023
- Jeff Sayer - H1 2023 Market Review and Outlook - Real Asset Strategies
- Global Real Estate Fund 05/2023
- Global Real Estate Fund 04/2023
- Global Real Estate Fund 03/2023
- Global Real Estate Fund 02/2023
- Global Real Estate Fund 01/2023
Toronto, Ontario M5J 2J1 Canada