
 August 31, 2026
Commentary




The monthly commentary discusses recent developments across the Ninepoint Diversified Bond, Ninepoint Alternative Credit Opportunities and Ninepoint Credit Income Opportunities Funds.
Central Banks
The conflict in Iran seems ever more stuck, with both sides increasingly irreconcilable. The buffers and reserves the world relies on to limit the damage of product shortages and higher prices are getting smaller, pressuring finished product prices (gasoline and diesel in particular) higher. What was once expected to be a short-lived conflict has now turned into a multi-month quagmire, with no resolution in sight. This is becoming an issue for policymakers, particularly central bankers, who fear energy prices could fuel another round of broad-based inflation.
Traditionally, central bankers tend to look through supply side shocks to prices, as their tools (i.e. short-term interest rates) are ill-designed to address supply side issues, instead behaving more like a brake pedal on aggregate demand. Add to this the long and variable lags with which monetary policy operates, and you have a very blunt tool to address “temporary” supply shocks.
That’s also why they tend to focus on “core inflation”, which strips out the volatile effects of food and energy prices on the consumer price basket. The traditional view: core inflation gives a better sense of the underlying inflationary pressures. More recently, alternative metrics like the “breadth of inflation” (i.e. the % of inflation categories growing faster than 3%) are gaining traction; the Bank of Canada explicitly mentioned it as something they are watching at the beginning of the conflict, as a way of assessing whether higher energy prices were polluting the rest of the CPI basket. More recently, at his inaugural Jackson Hole Symposium speech, FOMC Chair Warsh also mentioned the breadth of inflation as a gauge of inflationary pressures.
There are not universally accepted methodologies for constructing those “breadth of inflation” indicators, but that didn’t stop us from trying! In Figure 1 below, we show our own measures, which tried as much as possible to replicate the Bank of Canada’s own methodology, with the caveat that we cannot adjust for changes in taxes, and for simplicity’s sake, we do not weight the series by each component’s CPI weight, so small categories get the same treatment as larger ones, such as shelter. For the U.S., we took PCE data, and generated a simple, % of subcomponents above 3% time series.

As we can see from Figure 1, the breadth of inflation in Canada and the U.S. usually follows each other, and that makes sense, as both countries business and monetary cycles are usually in sync. But recently, we have seen it diverge quite meaningfully. Here in Canada, core inflation has been well behaved, sticking around 2% for the past several months, and that’s also reflected in weakening breadth of inflation, at just under 40% of categories growing over 3%. By contrast, in the U.S., core inflation has been stuck around 3%, and we have seen a troubling reacceleration of breadth, above 50% now, signaling that inflation pressures might be broadening.
This is exactly what central bankers want to avoid: a supply side shock that spreads through the economy and turns into a self-perpetuating inflationary cycle. Compounding this issue, we have a new FOMC Chair, Mr. Warsh, who was appointed by a president that keeps on calling for lower rates, and his track record on inflation management is still being assessed by markets. Bond market volatility reflects this uncertainty. The latest (August) inflation print in the U.S. was high enough to cement expectations for a rate hike at the FOMC’s September meeting. The bond market has been asking for more, with expectation for rate hikes almost above 100 basis points now (Figure 2 below). This kind of divergence signals that the bond market is “pushing” on the Fed for rate hikes and given Mr. Warsh's market background, he appears likely to respond. Our exposure to U.S. short-term interest rate risk is minimal currently.
Here in Canada, the situation is a little different. We have an economy that’s just rebounding from the trade shock last year (and perhaps heading into another one, but the BoC was quick to dismiss that risk), and still operating under potential. That’s very important, since the Bank of Canada operates in a framework that uses the state of the economy vs its potential as a guide to future inflation. If we are operating above potential, the economy’s overheating, pushing inflation up. That requires higher rates than neutral (they think 2.25-3.25% is the range of neutral, we are at the low end of that range right now).
But, if you are operating below potential, as we are now, you have a cool economy that’s not intrinsically pushing inflation higher, then you don’t require restrictive monetary policy. The proof is in the pudding, core inflation is still right around 2%. This explains the BoC’s hold stance all year, despite the rise in energy prices, at the bottom of the neutral range. That made a lot of sense.
Given the current conditions; there is still slack in the economy, core inflation has been right at target for a while now, the breadth of inflation is behaving well, it is puzzling to see such a hawkish pivot by Governor Macklem during the press conference. The market took that shift seriously and sold off aggressively. At the time of writing (which is arguably already in September), we now have a full 100 basis points of rate hikes priced-in by the bond market for the next 12 months (Figure 2 below, left panel). That would take the overnight rate above 3.25%, to a slightly restrictive stance.

Is it possible we do hike 100 basis points, starting in October? Yes, certainly.
Is it probable? That’s another question, but it relies on a lot of things happening:
- It requires the trade war with the U.S. not to escalate to the point that damages the economy more meaningfully,
- It also requires the housing market, which has just started to stabilize, to continue its rebound, despite much higher rates (and therefore mortgage rates). Housing/shelter is 30% of the CPI basket, and it’s currently growing at only 1.3% y/y, that’s a lot of disinflation vs the 2% target.
- It requires elevated gasoline and diesel prices to start polluting the rest of the economy, pushing other prices higher.
Those remain big unknowns; we therefore disagree with current market pricing for a hike as early as the October meeting (70% odds priced-in right now). It is way too early to tell. As much as in July we felt like the Canadian bond market was overly expensive, rates have repriced very quickly, and we believe that the move in Canadian interest rates is overdone here, with the risks erring on the side of a more dovish resolution than what is currently priced-in. Post month-end, we have therefore added a modest 0.4 years to Canadian duration in the Ninepoint Diversified Bond Fund.
Treasury
Now, central banks aren’t the only ones tinkering with interest rates anymore, Treasury Secretary Scott Bessent, after intervening in the Japanese currency market, has now decided that U.S. long term interest rates were too high for comfort. Under the guise of “liquidity improvements”, the U.S. Treasury announced, off schedule, that they would increase the size of their 20-30 year bond buybacks to a minimum of $4bn per operation, from a maximum of $2bn prior. The reaction was immediate, but short lived. 30-year bonds rallied by as much as 12 basis points that day, only to give it all back the next few days.
With U.S. government debt now over $40tn, and more importantly, above 100% of GDP, having the Treasury Secretary trying to intervene in the market to cap rates seems like the first step towards financial repression, a technique last used by the U.S. government during and following World War 2 (perhaps not coincidentally, also the last time debt to GDP was this high).
While we aren’t willing to be against the “House”, as Bessent now calls himself, he will have to do more if he wants to control interest rates. The day before the first increased size buyback, the Treasury announced it would be accepting up to $6bn, which was seen as light by market participants who were expecting something closer to $7-10bn. In the end, Bessent and his team were too price sensitive, and only managed to buy $5.1bn. Hardly a convincing show of force. If anything, he has lost further credibility with this debt buyback fiasco. Now, this administration has shown, time and again, that they are willing to break norms and rules, so we wouldn’t put it past them to try again, in an act of desperation ahead of the mid-terms. Mortgage rates are now about 7% in the U.S., and with gasoline/diesel prices also elevated, they are losing control of the narrative.
So, bottom line for U.S. rates, the FOMC will have a hard time fighting the market given the inflation narrative, and each time they disappoint, the long end sells off as they lose additional credibility as inflation fighters. They will have to hike, pushing the front end of the curve higher (the market has already done most of the heavy lifting for them at this juncture). As for the long end (10s and 30s), we are seeing this tug of war between the bond market and the Treasury Secretary, the market so far is winning, but we wouldn’t count Scott Bessent out yet. The more they tinker with markets, the more this debasement idea takes hold, leaving the U.S. dollar as the release valve. We maintain a full hedge on our (diminishing) USD exposure.
Credit Markets
The new issue calendar has been surprisingly busy this August, as many issuers tried to get in front of what is usually a very full month of corporate issuance in September. Investors know this and typically make room for the wall of new issues they are expecting in the Fall, pressuring spreads a little wider.
So far September is coming in a little light, perhaps higher bond yields are deterring issuers from coming to market, and a lot of them already came in July and August to pre-fund Fall maturities. This is resulting in a relief rally, and we have seen credit spreads outperform their usual beta to equities.
Following month end, we have covered our short positions in hyperscaler bonds. They have been leading the rally, and we wanted to crystallize our gains. Otherwise, there has been little change in our positions.
We constantly review the positions in our portfolios. Generally, anything with a yield of less than 4% gets replaced with a more attractive opportunity. This process helps maintain higher levels of portfolio yield, weeding out positions where the thesis has run its course. With higher yields across the curve, it is increasingly easy to find solid companies whose bonds are attractive, without having to take too much duration risk.
Ninepoint Fixed Income Funds
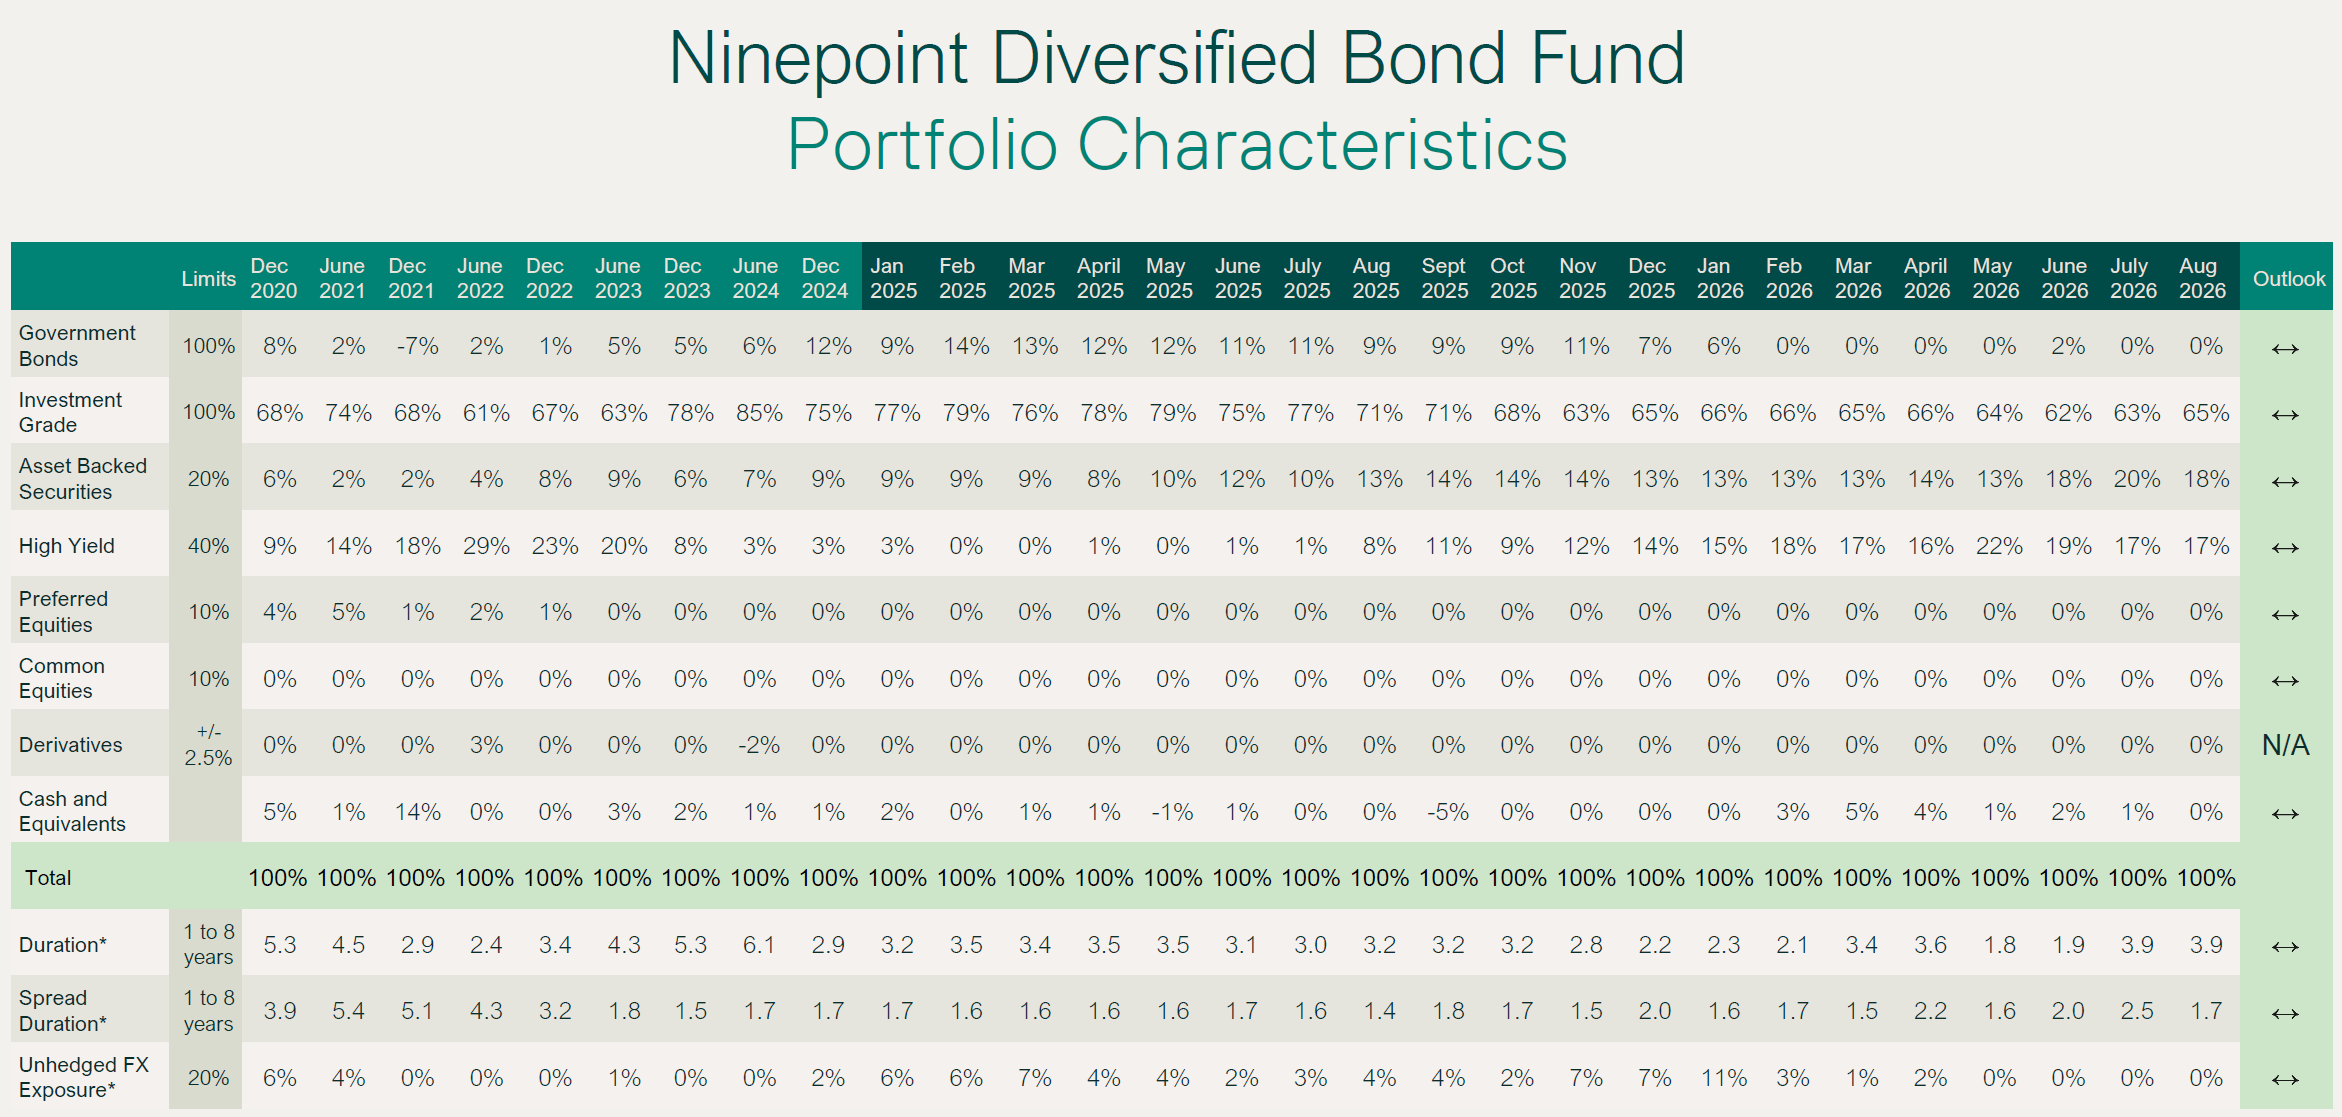
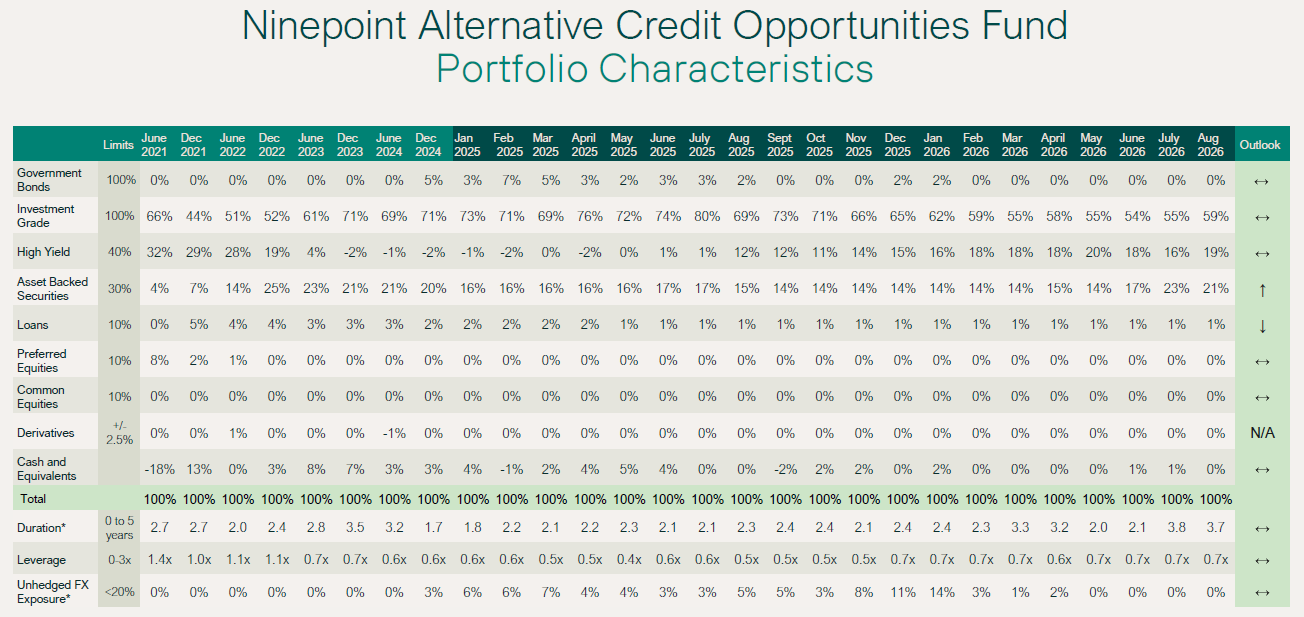
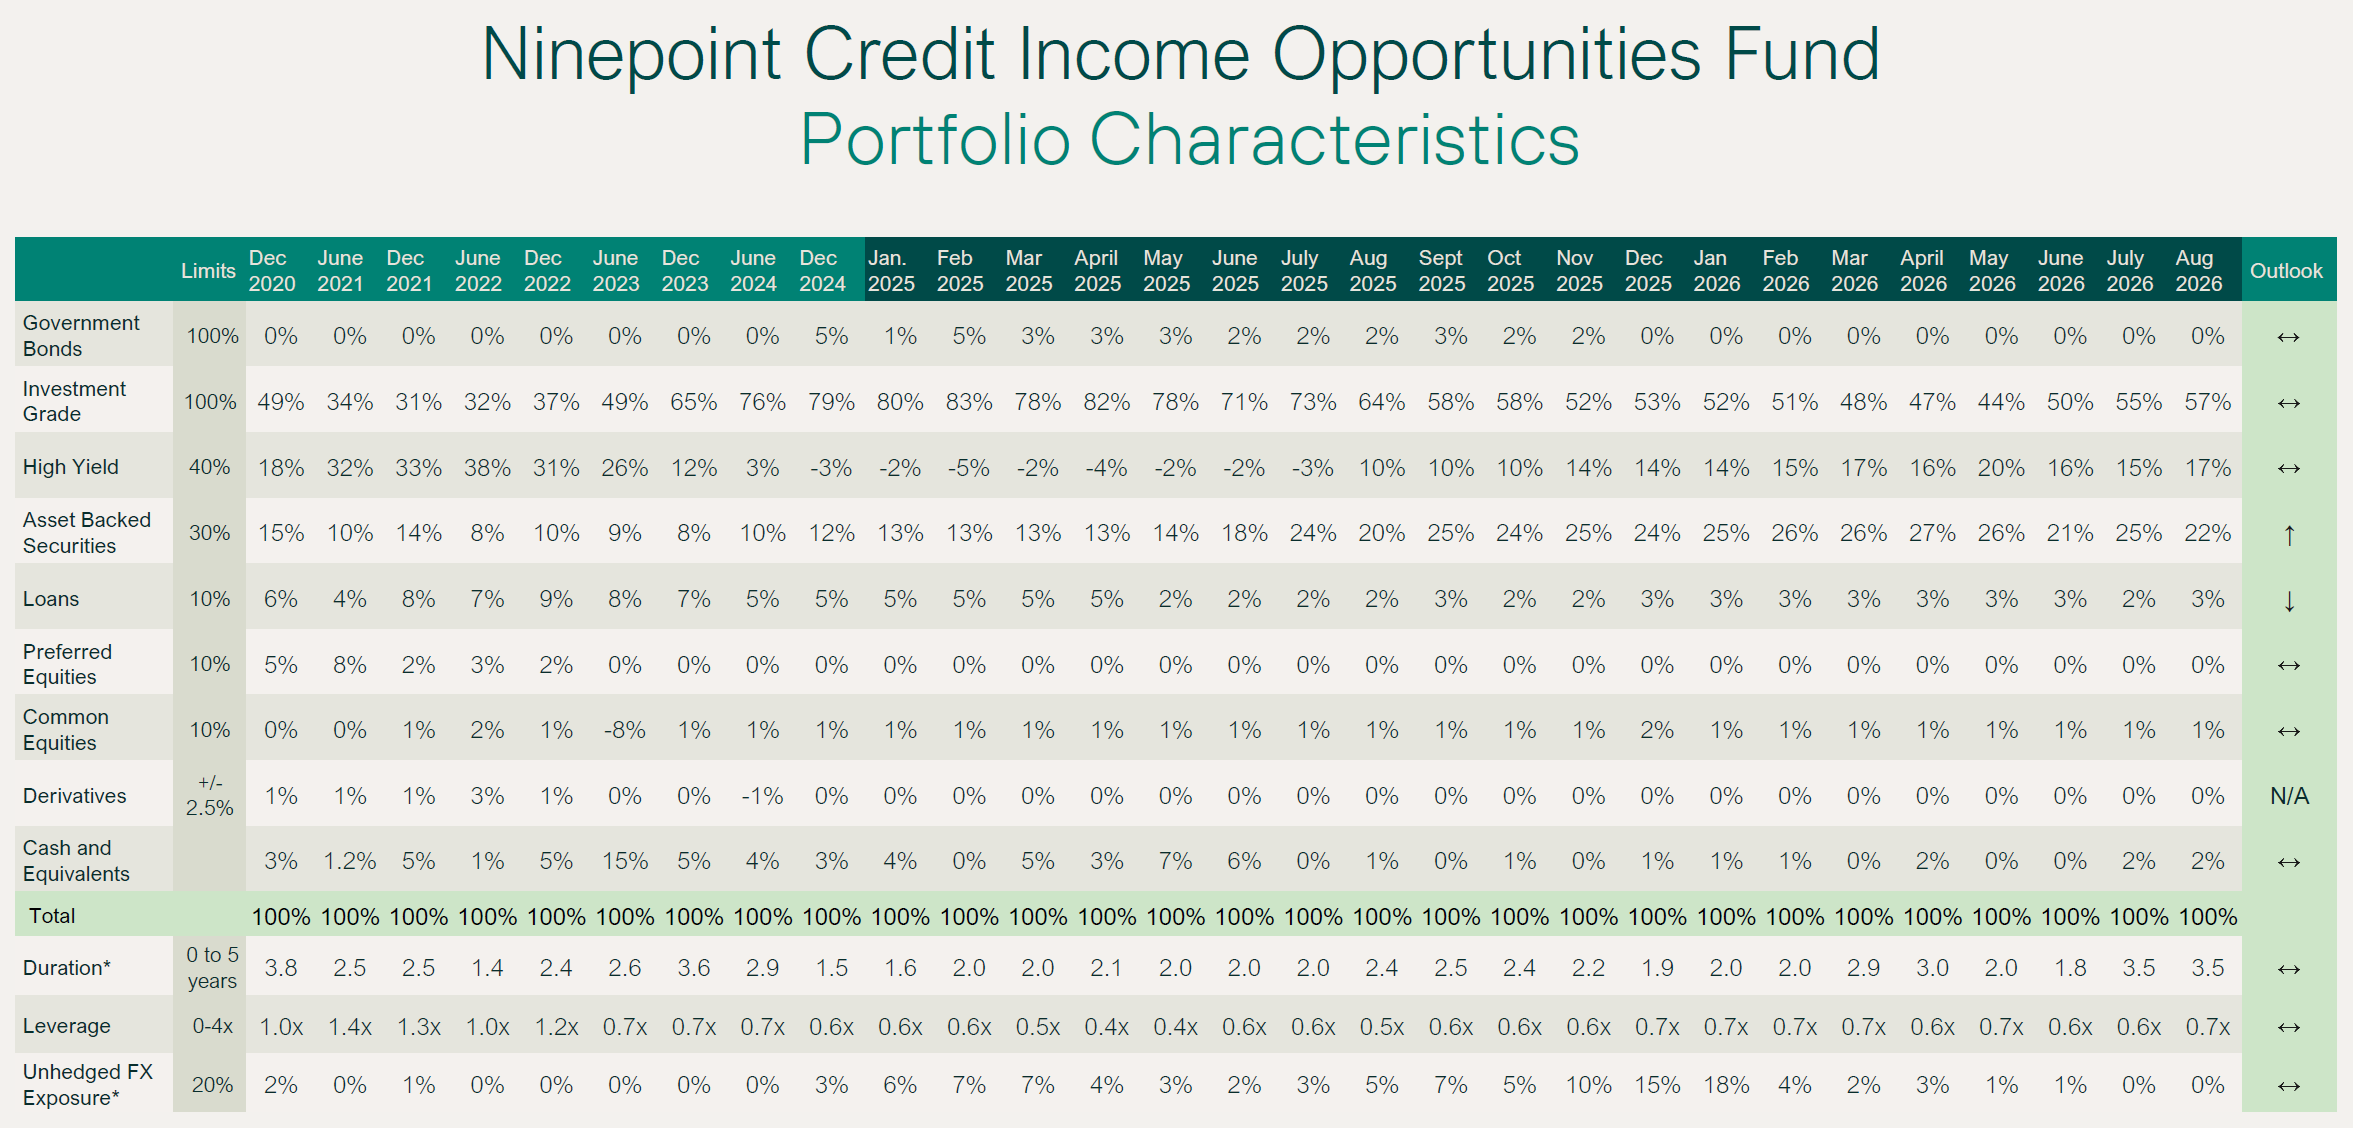
Table 1 below shows the various statistics and exposures as of August month end. As discussed last month, following the selloff in U.S. rates to levels last seen in 2007, we increased duration to just under 4 years (from around 2 years earlier this year) using options. Credit duration has also moved back down, as we added CDX hedges going into September. With CDX IG at ~50 basis points, the low end of its historical trading range, we sold calls to buy 2x as many puts for no cost. Against that, we added a bit of leverage (+0.1x) in 6 to 12-month corporate bonds. Our positioning in credit remains quite defensive, while in rates, with the massive selloff we have seen, we are comfortable with a little more duration.

Conclusion
What a year it’s been so far.
The war in Iran is forcing central bankers globally to consider another rate hike cycle.
Elevated government deficits are pushing up yields along the yield curve, inviting manipulation by officials.
Meanwhile, equities are enjoying the sugar rush of the AI capex boom.
Defensive and opportunistic is the sensible posture for the time being.
Have a great Fall,
Mark, Etienne & Nick
As always, please feel free to reach out to your product specialist if you have any questions.
Ninepoint Diversified Bond Fund
NINEPOINT DIVERSIFIED BOND FUND - COMPOUNDED RETURNS¹ AS OF AUGUST 31, 2026 (SERIES F NPP118) | INCEPTION DATE: AUGUST 5, 2010
1M |
YTD |
3M |
6M |
1YR |
3YR |
5YR |
10YR |
15YR |
Inception |
|
|---|---|---|---|---|---|---|---|---|---|---|
Fund |
0.13% |
1.19% |
0.05% |
0.04% |
2.51% |
5.86% |
1.56% |
2.60% |
3.40% |
3.49% |
Click for larger image
Ninepoint Alternative Credit Opportunities Fund
NINEPOINT ALTERNATIVE CREDIT OPPORTUNITIES FUND - COMPOUNDED RETURNS¹ AS OF AUGUST 31, 2026 (SERIES F NPP931) | INCEPTION DATE: APRIL 30, 2021
1M |
YTD |
3M |
6M |
1YR |
3YR |
5YR |
Inception |
|
|---|---|---|---|---|---|---|---|---|
Fund |
0.23% |
1.91% |
0.46% |
0.54% |
3.35% |
6.80% |
2.74% |
2.88% |
Source: Ninepoint Partners. Subject to change without notice.
Click for larger image
Ninepoint Credit Income Opportunities Fund
NINEPOINT CREDIT INCOME OPPORTUNITIES FUND - COMPOUNDED RETURNS¹ AS OF AUGUST 31, 2026 (SERIES F NPP507) | INCEPTION DATE: JULY 1, 2015
1M |
YTD |
3M |
6M |
1YR |
3YR |
5YR |
10YR |
Inception |
|
|---|---|---|---|---|---|---|---|---|---|
Fund |
0.37% |
1.68% |
0.52% |
0.52% |
3.34% |
6.54% |
3.47% |
4.94% |
4.81% |
Click for larger image