 June 30, 2026
Commentary




The monthly commentary discusses recent developments across the Ninepoint Diversified Bond, Ninepoint Alternative Credit Opportunities and Ninepoint Credit Income Opportunities Funds.
What a year it has been so far. We are now past the mid-point of 2026, and as we typically do, we will recap the year so far, and offer our thoughts for the second half.
First off, it is always informative to look at the behavior of North American interest rates and credit spreads, the two main drivers of volatility in our funds. Table 1 below shows, for both Canada and the U.S., the year-to-date change in rates across the curve, along with the major credit indices (IG and HY). Despite both central banks being on hold this year (i.e. no change in the overnight rate), we had a lot of rates volatility.

Of course, the increase in oil prices due to the war in Iran had its bearish impact on rates, but with crude prices down meaningfully from the peak, there is clearly something else going on, otherwise, why would U.S. 2-year rates still be up by 70bps (and 4x more than here in Canada)?
We believe that the answer is inflation and economic growth divergence. Thinking back to the start of 2026, economic growth in Canada was muted (we even had two consecutive quarters, 2025Q4 and 2026Q1, of mildly negative growth), the unemployment rate was flirting with 7%, and inflation was at the 2% target. Notwithstanding the war in Iran and the oil shock, the Bank of Canada (BoC) would have probably cut interest rates in the spring. Therefore, the message from the BoC has been consistently clear, they are in no rush to increase rates and can be patient. The bond market has finally heard them, and that is why rates have behaved so well, with very modest net changes in interest rates so far in 2026 across the curve.
Now, the situation in the U.S. is completely different. Between fiscal stimulus (remember the OBBB?), the AI CAPEX boom, unemployment at 4.2% and core inflation still stuck above 3%, there is a strong case to be made for interest rate hikes, even with oil prices now back in the $80 range. Additionally, the new FOMC Chair, Kevin Warsh, took advantage of his first meeting at the helm of the Fed to firmly establish his inflation fighting credentials, repeatedly mentioning inflation as a choice and a direct consequence of monetary policy decisions. Now, it is unlikely that we see a Fed rate hike in July, but sometime in the Fall is certainly on the table if core inflation remains elevated and starts broadening out due to widespread price pressures. We believe that U.S. hikes late 2026 are certainly a possibility, and that, barring a negative growth surprise, U.S. interest rates are not likely to go much lower from here.
Click for larger image
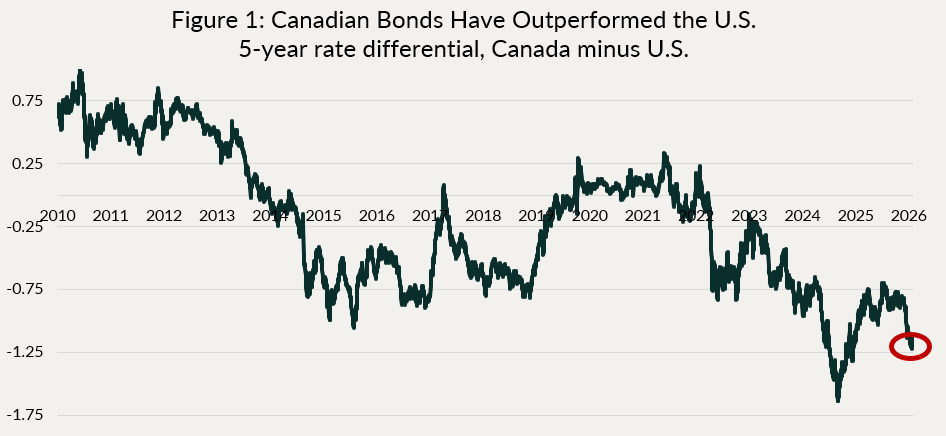
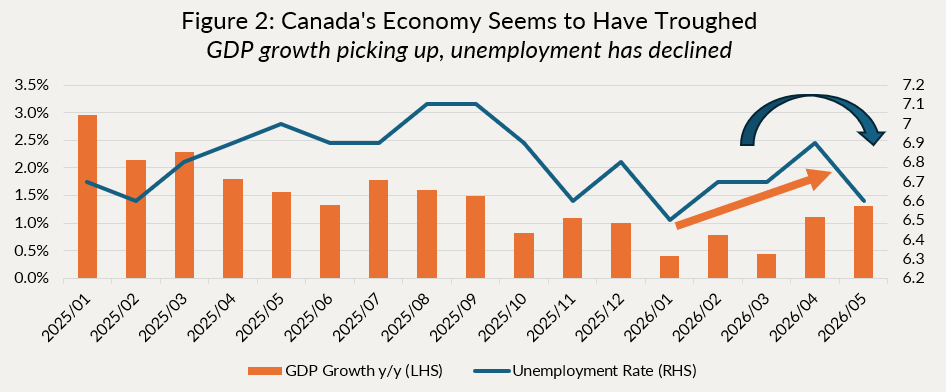
This economic divergence between Canada and the U.S. has now pushed interest rate differentials to extremes, just like last year during the worst of the trade war angst (Figure 1 above shows the difference between 5-year rates in Canada and the U.S.). That is one of the main reason the Canadian dollar has performed so poorly year-to-date versus the Greenback (-3.32%). But, in recent months, we have seen green shoots in the Canadian economic data, which shows signs of bottoming out (Figure 2). Unemployment has declined in May on the back of strong full-time payrolls, and GDP growth is broadening out. Therefore, we believe that the outperformance of Canadian bonds vs U.S. bonds has run its course as we see risks to the upside to Canadian data. But, unlike last year where this gap was resolved by a U.S. bond rally, we believe that this year, given better data, we could see the market price-in a few BoC rate hikes late this year or early next year, pressuring bond yields higher.
Click for larger image
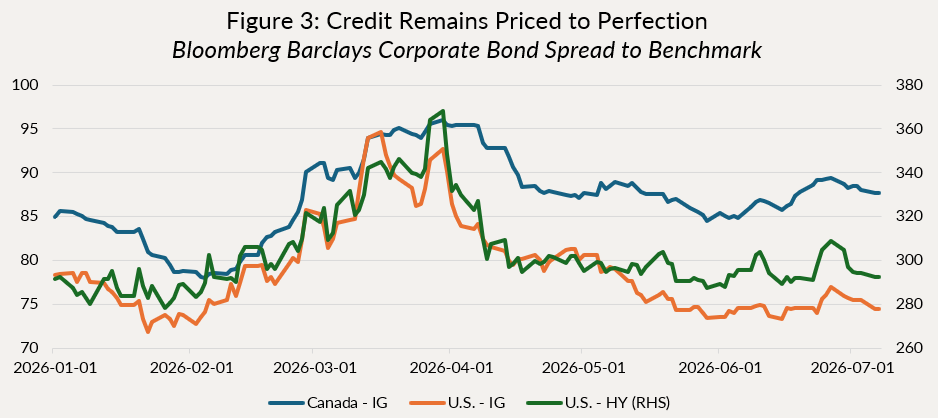
Credit markets, just like equities, continue to be buoyant. Yes, we saw some weakness in February centered around software firms and private credit exposure, quickly followed by a general risk off mood spurred by the war in Iran, but that has mostly reversed. As shown in Figure 3 below, credit spreads across North America remain right around the year’s (and multi-decades) tights.
Click for larger image
Under the surface, there is more dispersion, as some sectors remain weak due to record issuance (AI datacenters and tech) and ongoing credit concerns (BDC, software, consumer lending and lower quality high yield). Nonetheless, there remains a seemingly insatiable appetite for anything with a yield on it, and selloffs are quickly bought.
2026 is on track to break issuance records; in Canada, we are up 60% versus the same time last year, and in the U.S. about 30%. So far, the market has been able to absorb all this paper quite well, but each new mega-deal is taking longer and longer to digest. Given the preference of some of these issuers for long term bonds (10, 30, 40yrs), we have seen credit curves steepen materially. We continue to avoid these sectors or points on the curve where we think pressure will continue to build, as demand for funding by AI companies shows no sign of slowing down.
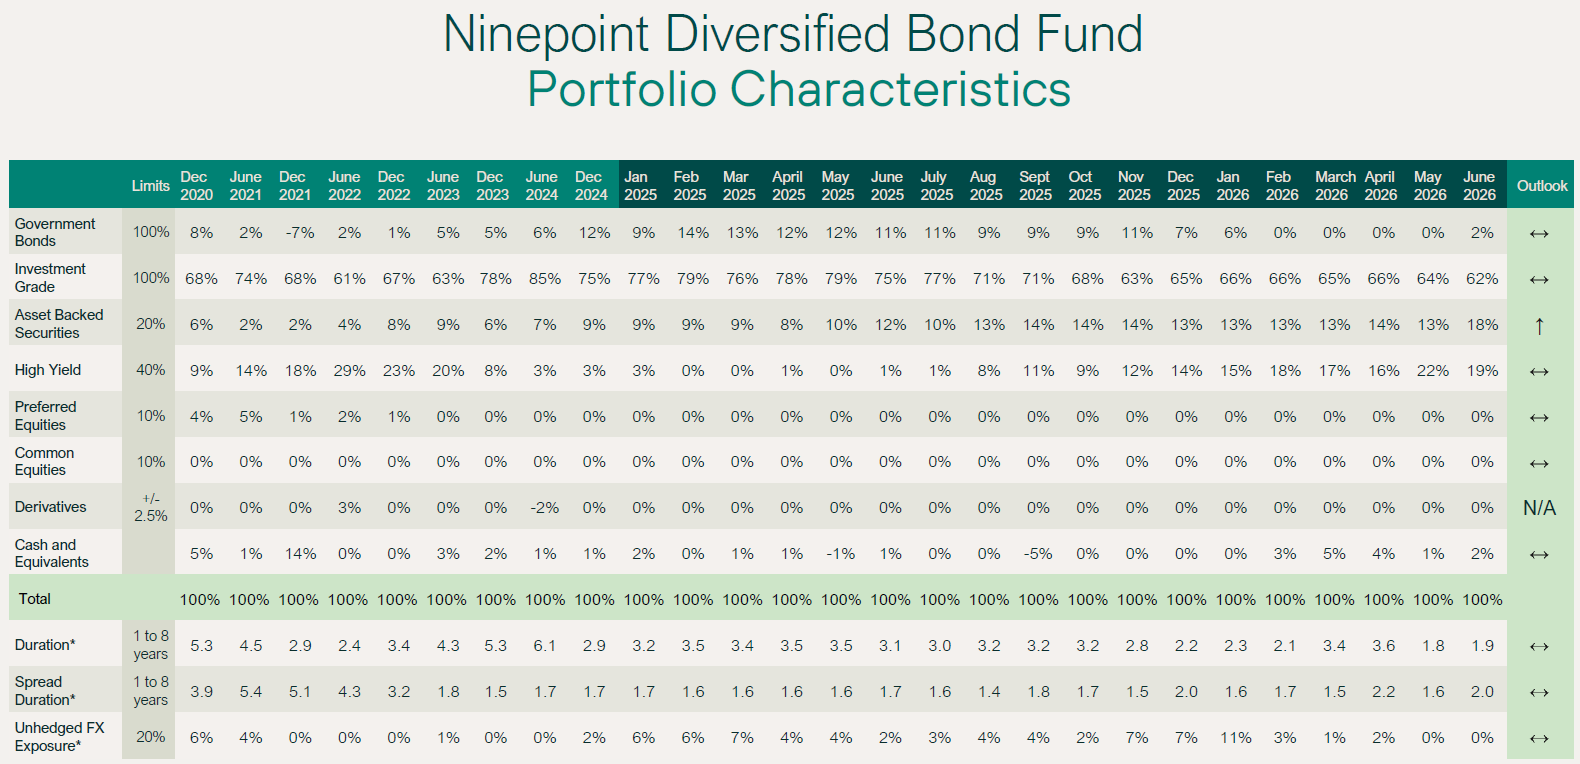
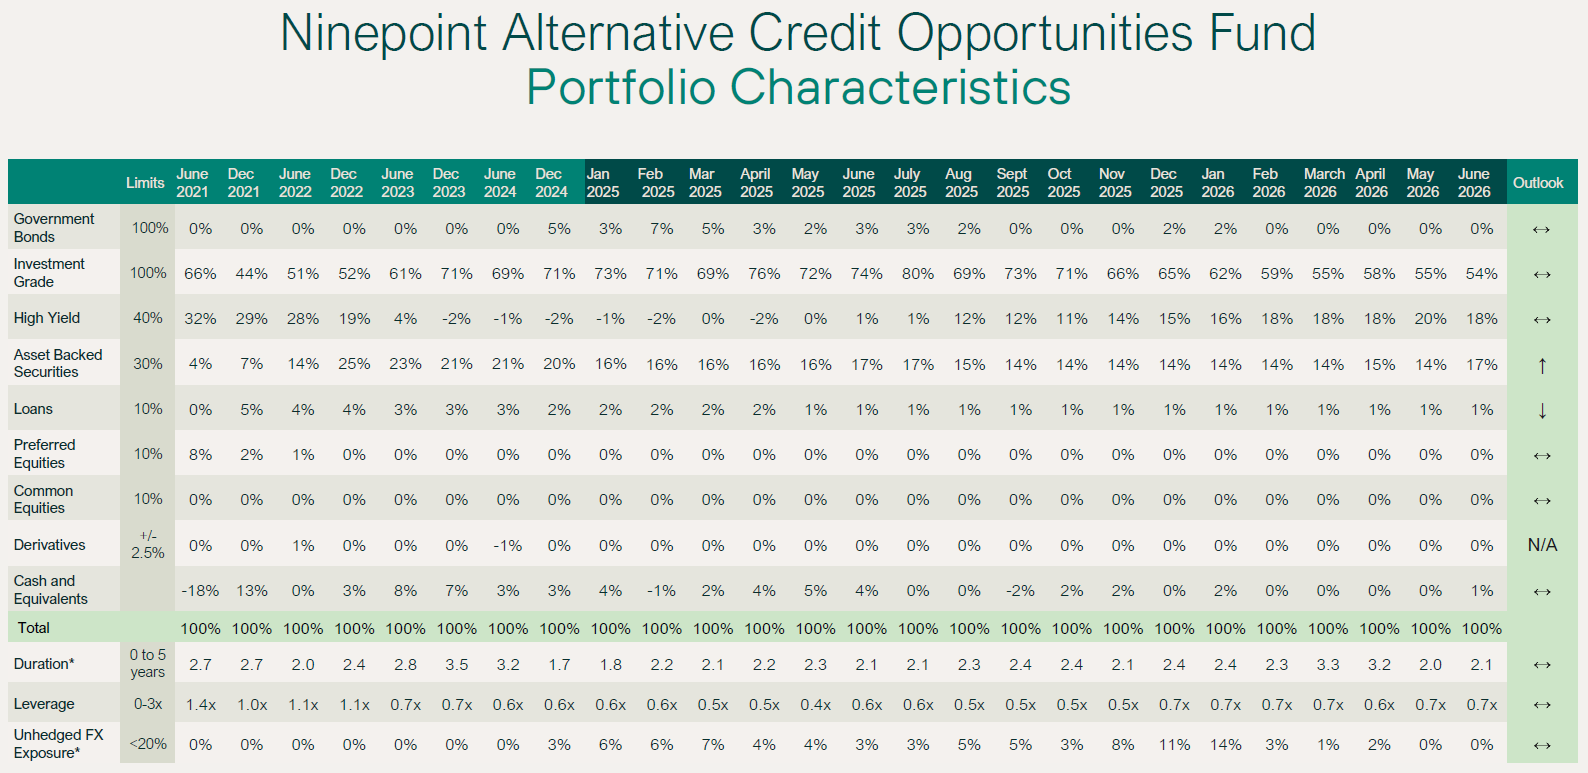
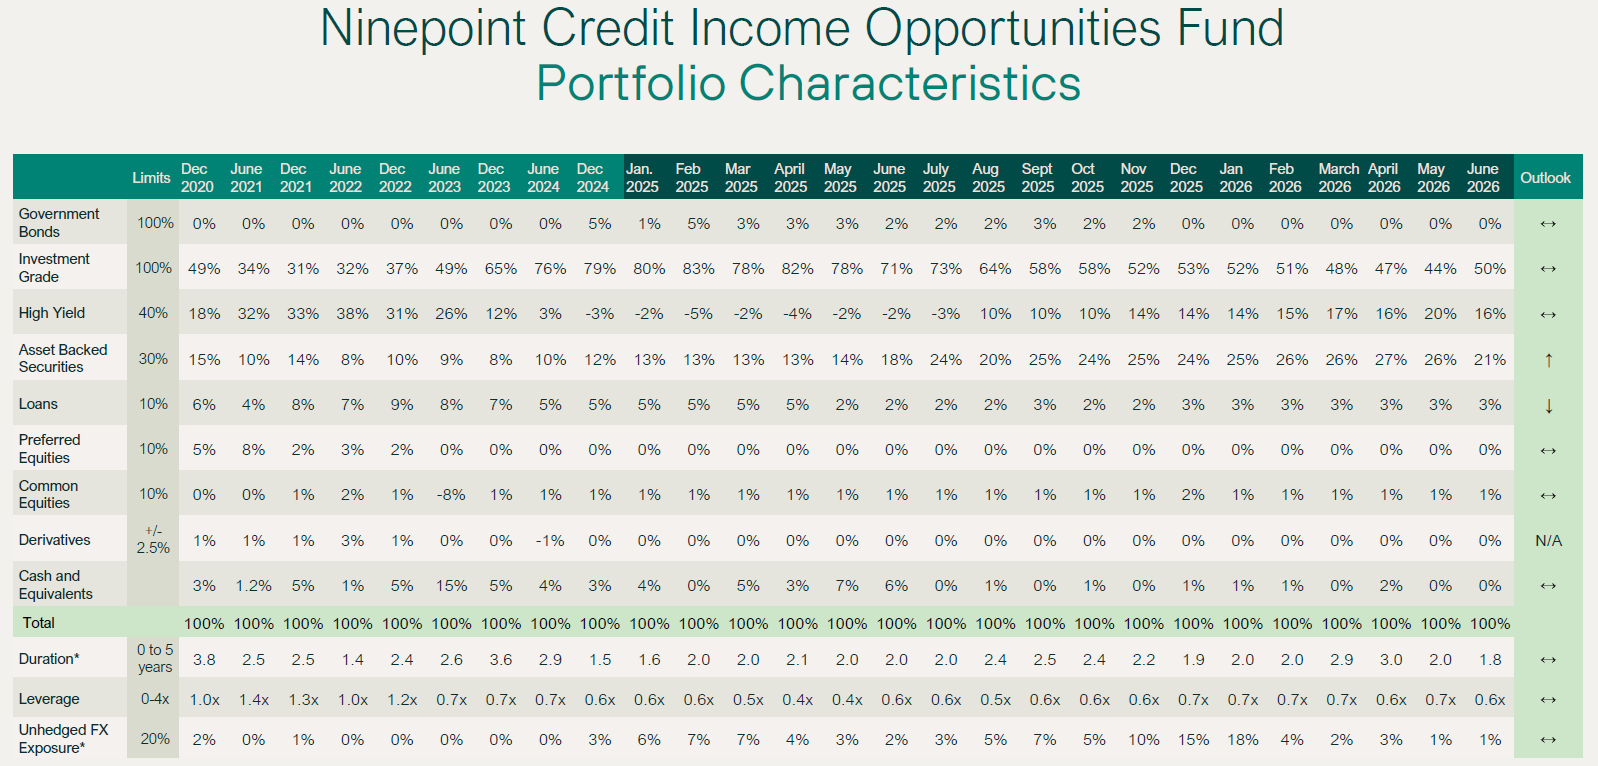
Overall, we remain cautious on credit, preferring to keep some powder dry. We like short duration investment grade bonds with yields around 4%, corporate hybrids, which yield anywhere between 4% and 7%, and Asset Backed Securities (ABS), where we have been adding. Canadian ABS is one of the few corners of the credit markets where we can find great relative value and attractive risk reward opportunities. We participated in several transactions, spanning collateral types like commercial mortgages, secured consumer loans, car fleets and credit cards.
Table 2 below shows the various statistics and exposures as of June month end. Our duration is at a comfortable 2 years, while spread/credit duration remained very low, due to the impact of credit hedges and our preference for short dated bonds. Leverage is slightly higher in NACO than Credit Ops, mostly due to a large maturity we have yet to backfill. Given how cheap credit hedges are right now, we are staying fully invested, while layering this extra protection. We see this as a good way to maximize income while keeping a very defensive posture.
If Canadian economic data starts to surprise to the upside, the Loonie could start clawing back some of the year-to-date losses. We remain fully hedged on our U.S. dollar exposure.

Conclusion
We are always trying to maximize income, while managing two main sources of risk: interest rate and credit risk. At this juncture, our portfolios yield between 5% and 6%, with very limited net exposure to both duration and credit duration, as we see risks to the upside to rates (particularly Canada) and credit spreads (still close to all time lows). This is a tricky environment, so better to continue to be patient and wait for better risk-reward before dialing exposure back up.
Until next month,
Mark, Etienne & Nick
As always, please feel free to reach out to your product specialist if you have any questions.
Ninepoint Diversified Bond Fund
NINEPOINT DIVERSIFIED BOND FUND - COMPOUNDED RETURNS¹ AS OF JUNE 30, 2026 (SERIES F NPP118) | INCEPTION DATE: AUGUST 5, 2010
1M |
YTD |
3M |
6M |
1YR |
3YR |
5YR |
10YR |
15YR |
Inception |
|
|---|---|---|---|---|---|---|---|---|---|---|
Fund |
0.31% |
1.45% |
0.79% |
1.45% |
3.60% |
5.91% |
1.81% |
2.88% |
3.24% |
3.55% |
Click for larger image
Ninepoint Alternative Credit Opportunities Fund
NINEPOINT ALTERNATIVE CREDIT OPPORTUNITIES FUND - COMPOUNDED RETURNS¹ AS OF June 30, 2026 (SERIES F NPP931) | INCEPTION DATE: APRIL 30, 2021
1M |
YTD |
3M |
6M |
1YR |
3YR |
5YR |
Inception |
|
|---|---|---|---|---|---|---|---|---|
Fund |
0.49% |
1.94% |
1.34% |
1.94% |
4.60% |
7.02% |
2.89% |
2.98% |
Source: Ninepoint Partners. Subject to change without notice.
Click for larger image
Ninepoint Credit Income Opportunities Fund
NINEPOINT CREDIT INCOME OPPORTUNITIES FUND - COMPOUNDED RETURNS¹ AS OF JUNE 30, 2026 (SERIES F NPP507) | INCEPTION DATE: JULY 1, 2015
1M |
YTD |
3M |
6M |
1YR |
3YR |
5YR |
10YR |
Inception |
|
|---|---|---|---|---|---|---|---|---|---|
Fund |
0.51% |
1.67% |
1.20% |
1.67% |
4.56% |
6.88% |
3.64% |
5.21% |
4.89% |
Click for larger image