Ninepoint Alternative Health Fund
July 2023 Commentary
Summary
In this month’s commentary we analyse Terrascend’s (TSND) recent up-listing to the TSX and the implications of up-listing on other MSO’s seeking greater liquidity and broader US investor participation than the current environment where MSO’s are mostly listed on the CSE. The most significant factor related to this move is that major US Custodians have embraced the move and are now allowing TSND to be traded and settled. We also discuss how an increasing number of States are working with the cannabis industry in providing a framework to lessen the tax burden the industry faces from federal illegality. The Controlled Substances Act (CSA) designation as a Schedule I narcotic results in penalties related to IRS 280E provisions. Finally, we look at the terminated merger between Cresco Labs (CL) and Columbia Care (CCHW) and the implications for the two companies after a 15-month courtship. Financial results for leading healthcare and pharmaceutical companies are also provided with Q2 results from (JNJ, ABT, MRK, UNH) as well as the strong pre-announcement of Q2 results from TSND.
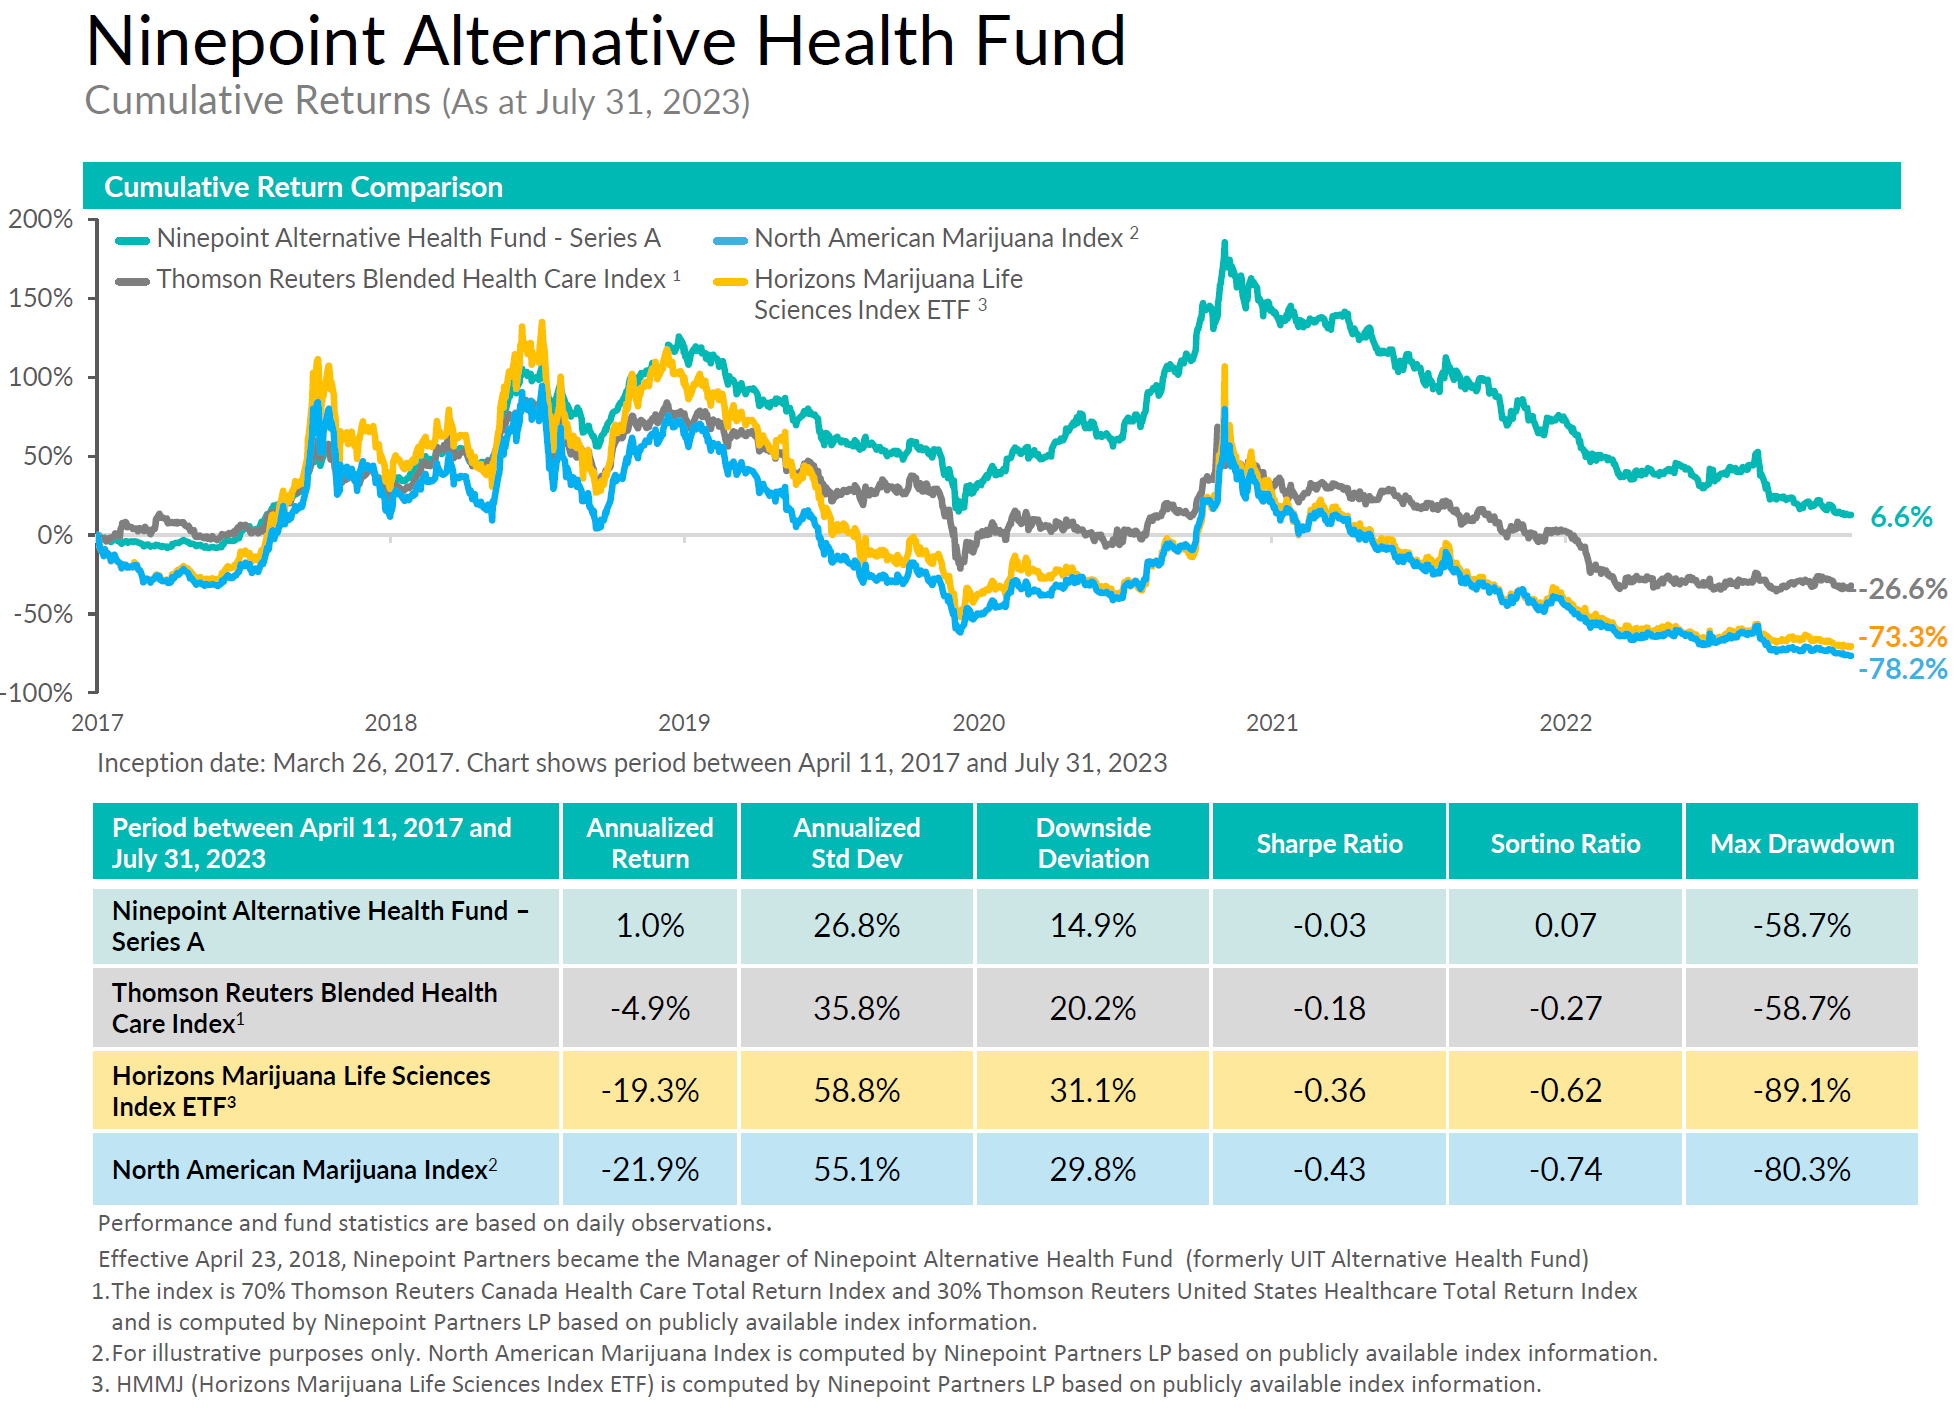
YTD healthcare has been a great stabilizer for the Fund with the SP Healthcare index basically flat at -0.4% YTD to the end of July. Cannabis has been challenged by the negative headwinds caused by inflationary pressure and weakened consumer spending in both Canada and the US. The Canadian cannabis index represented by HMMJ is down -18.5% YTD while the US MSOs, represented by MSOS are down 19.6%. Despite headwinds faced by the key US MSOs (multi-state operators) in the Fund, we continue to see strong operations and growing cash flows. The above-mentioned opportunity for MSOs to up-list to the TSX is a bright spot that we believe will have significant implications for many MSOs that look to unleash the liquidity and trading power with US institutions that can be harnessed as US Custodians embrace these TSX listings.
While healthcare returns have been mixed year to date, we continue to see strong fundamentals for the sector, with an historically low of less than 8% of Americans without healthcare/insurance coverage, there is ease of access combined with pent-up demand for health services. On the cost side easing some of the inflationary pressures (particularly related to labour is also contributing to more efficient operations and as a result, the healthcare sector is poised to deliver solid shareholder returns.
Terrascend Up-lists to the TSX
TerrAscend Corp. (TSND) began trading on the Toronto Stock Exchange on July 4th. It was the first time a U.S. plant-touching cannabis company has listed on a Tier-1 North American exchange. Some would question whether the TSX is a tier 1 exchange, however, given the reaction to the TSX listing, we believe the TSND listing on the TSX has significance. Recall that a major impediment to attracting US institutions to the cannabis space has been a reluctance on the part of US custodians to allow US marijuana-related businesses (MRB’s) to settle on the books of various institutions. In response to the July 5th listing, within the first 5 days of trading, major custodians in the US sent out instructions that have considerable ramifications for the US cannabis industry. U.S. investment bank, Morgan Stanley, was the first to send out instructions to ‘immediately remove any blocks/restrictions that were previously placed on this security (TER now TSND). Subsequently, BNY Mellon’s Pershing unit removed TSND from its “blocked” list. The result of US Custodians allowing TSND available for trading and settlement without blocks makes the company the only U.S. multi-state operator available for settlement by these large US Custodians.
Why is this significant? Since 2018, there has been a general reluctance on the part of compliance professionals in the US to allow settlement of US plant touching businesses or what is known as MRBs (marijuana related businesses). Releasing all blocks enhances the acceptability of TSND for investors, allowing it to have easier access to capital; greater liquidity than other MSOs; a larger pool of analyst coverage; enhanced ability to raise capital and increased flexibility on M&A transactions. Given the improved access to US investors, we anticipate the TSND move is the first of many up-listings to the TSX. There are benefits to up-listing for all MSOs, however, each MSO has specific issues to consider with the path to the TSX requiring some restructuring by MSOs. However, the ability to gain increased liquidity may be enough for management teams to consider making the move.
States Enact Policies to Assist MSO’s with IRS 280E Tax Burden
We have long stated that significant federal reform begins at the state level. As more and more states transition to REC, we see the percentage of the population living in a REC legal market continue to grow. This year, as part of the Biden Administration's announcement around re-scheduling cannabis on the Controlled Substances Act (CSA), there has been increased attention to combined state and federal taxes that cannabis companies pay in the US. The reason for the increased review is that if cannabis can be re-scheduled to a Schedule III drug similar to codeine, then significant tax enhancements can be brought to the industry.
The US cannabis industry is currently subjected to Section 280E of the US Internal Revenue Code (IRS). Essentially what 280E means for US MSO’s is that operators are effectively taxed at the gross profit level, which causes an increased headwind on their ability to generate cash flows. Essentially, Section 280E of the IRS tax code prohibits marijuana businesses from taking traditional business deductions because the marijuana plant is listed as a Schedule 1 drug under the federal Controlled Substances Act. A way to reduce the tax burden for MSO’s has occurred in various state legislatures where states have individually passed legislation to separate state tax from IRS 280E. States have passed laws that will allow cannabis companies to deduct business expenses from their state income taxes, despite those businesses still being federally illegal.
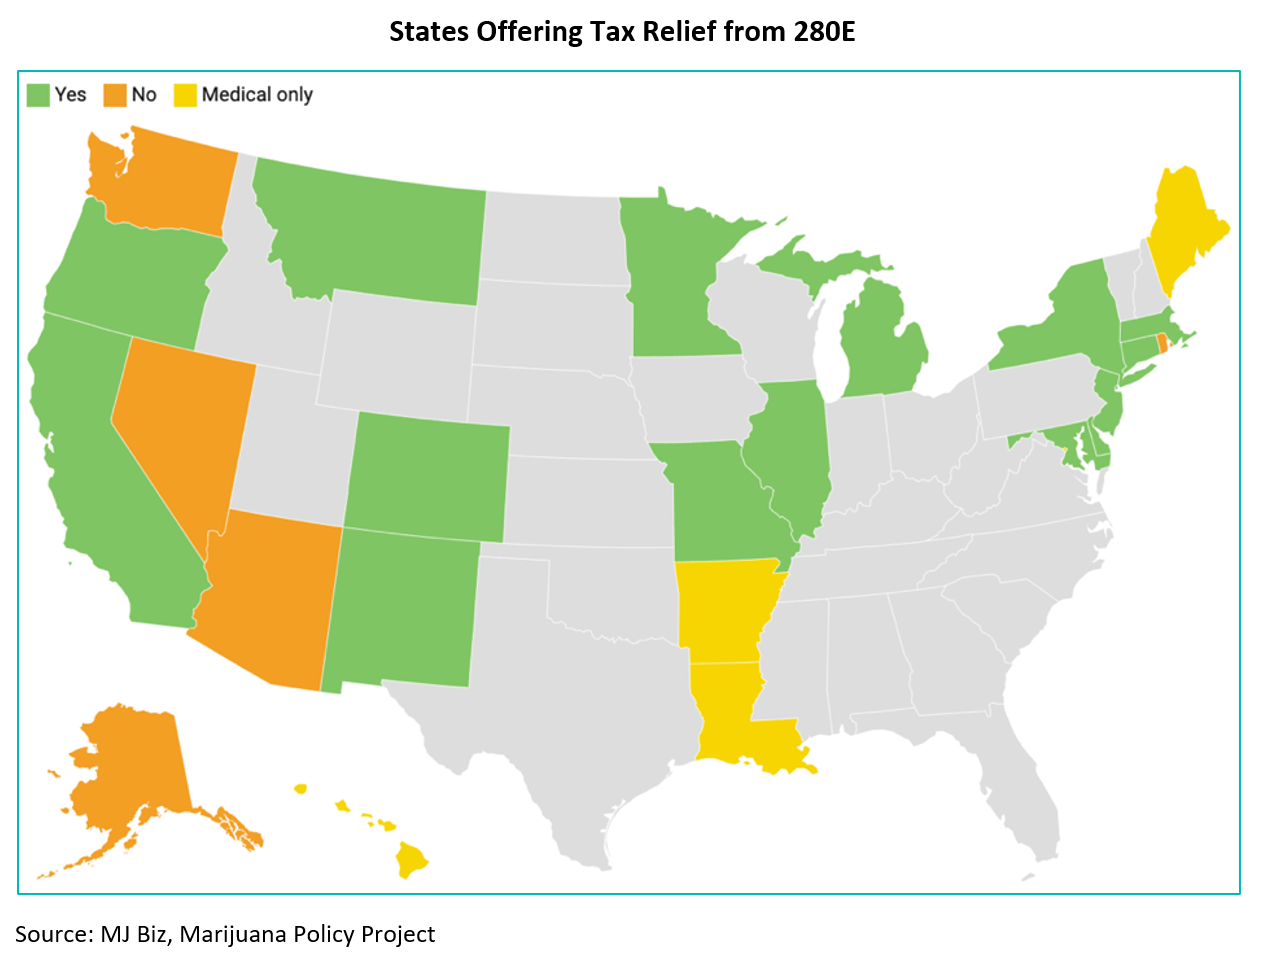
During 2023 four state legislatures; Connecticut, Illinois, New Jersey and New York passed legislation that will allow cannabis companies to deduct business expenses from their state income taxes, which provides partial relief from the high marginal tax rates caused by 280E.
There is an interesting dynamic that states are dealing with currently. Cannabis companies are large and growing employers, yet due to select state regulatory and/or tax burden, states are generating less tax revenues than they did in previous years. For some states such as California where the combined regulatory and tax burden has created a market where there is over-taxation and over-regulation, it is challenging for legal cannabis businesses and results in a growing illicit market where the state does not generate any tax revenue. Proactive states realize that tax revenues and jobs could be impacted if companies close due to tax burden, thus exemptions that allow the sector to operate and deduct business expenses just like any other industry is vital to various state governments.
Termination of Merger in US Cannabis
We provide our view of the transaction announcement, despite the fact that the Fund does not have exposure to either of these names currently. Cresco Labs (CL) & Columbia Care (CCHW) jointly announced at the beginning of August that they have come to a mutual agreement to terminate the mid 2022 arrangement that would have seen CL acquire 100% of CCHW’s issued and outstanding equity. Last month CL and CCHW noted that they were not able to complete the necessary divestitures required to meet regulatory approvals in order to complete the transaction. There were a multitude of states where both companies had licenses and the combined entity was required to divest and add that capital to the cash flow of the new combined entity. There was a divestiture agreement involving duplicated licenses in New York, Illinois, and Massachusetts, however over the last year, values have come off from previously announced terms and that became a critical challenge to close the transaction. In addition, the map below highlights in orange some key states for CL/CCHW that have materially softened over the last 12 months including California; Colorado; New York and Massachusetts.
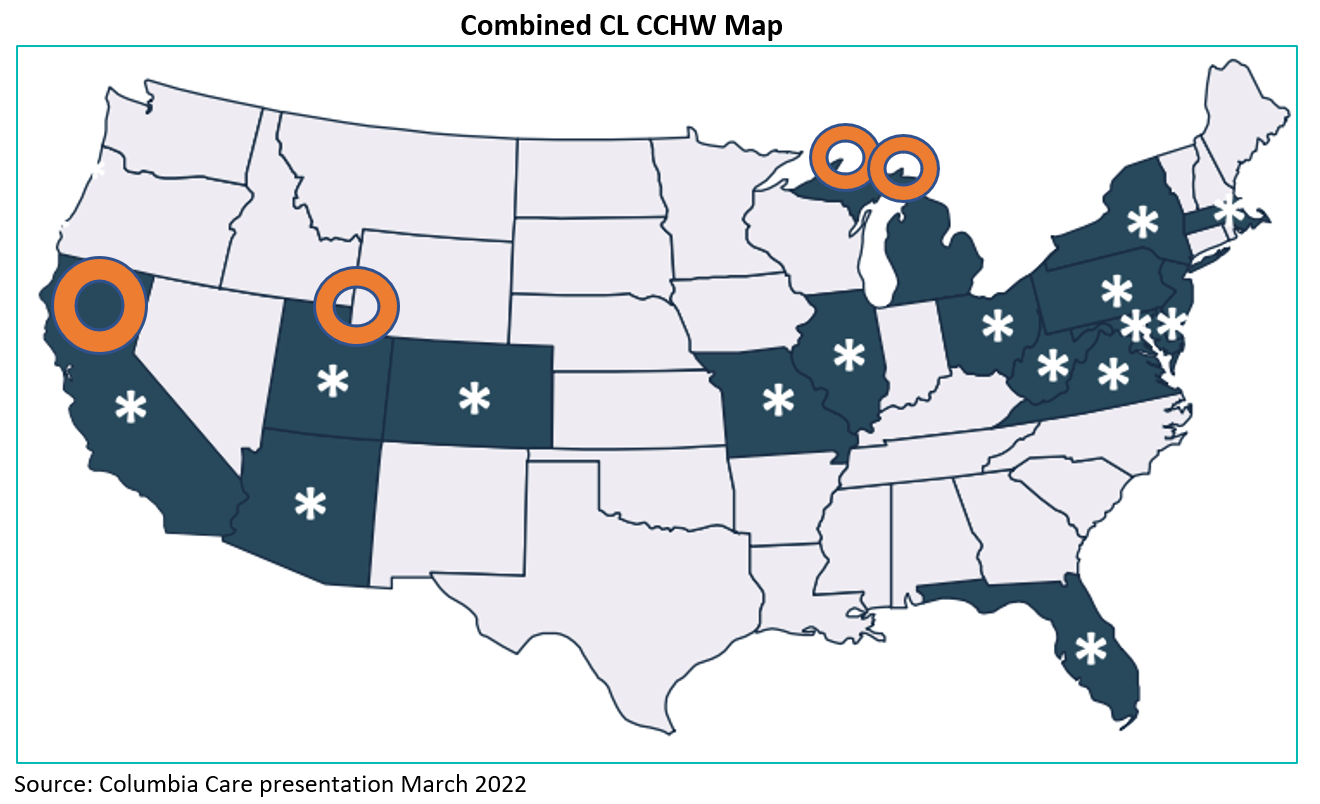
Our review of the two businesses illustrates that not all US cannabis companies should be treated similarly. Also, not all state markets have the same opportunity for growth. During the last 12 months, many operators have announced reductions or closing of operations in western states, especially California where the regulatory and tax regimes are significant hurdles to profitability. Colorado is also a state where intense competition results in challenges, with only the most efficient operators able to generate free cash flow. Massachusetts has seen significant drop off in sales. Finally, New York has been a significant disappointment on the regulatory front with the state government either unable or unwilling to allow cannabis businesses to flourish. We highlight these states in the discussion of CL & CCHW as their operations were in these states, and the value of assets to divest was negatively impacted by the current regulatory regimes.
Going forward the two businesses have initial operational goals to achieve. CL has a considerable operational presence in the wholesale business. However, at a time when many MSOs are focused on verticality, there is less enthusiasm for wholesale providers in certain markets. That results in CL working to pivot from its lower margin wholesale business, focusing on enhancing its retail strategy. For CCHW, it has taken strides to reduce overheads in certain markets such as CA, while turning its attention to the various east coast markets that have better growth prospects.
Financial Results
JNJ Beats with Solid Operational Growth
Johnson & Johnson (JNJ) came out with strong Q2 results with operations across all divisions providing solid growth. For the quarter JNJ beat street estimates with revenues up 6.3% to $25.5 billion vs estimates of $24.6 billion, while Adj EPS was better than estimates, up 8.1% to $2.80 vs $2.60/share. Overall operational growth reached 7.5% in Q2. On the pharmaceutical side, growth was 3.7% to $13.7 billion driven by medications such as DARZALEX (multiple myeloma) and TREMFYA (psoriatic arthritis). Med Tech continues to build with growth of 10% led by various solutions such as heart arrhythmia, surgical procedures and vision care.
The consumer health side also contributed, up 7% in Q2. The strong quarter allowed management to raise guidance for the balance of the year.
There has been some headline noise around JNJ which we do not believe changes the long-term thesis for holding JNJ as a key Fund position. First, the company announced its intention to do an exchange offering of the remaining 89% of KVUE that it owns. This will be subject to market conditions. We do not believe this should be considered a headwind as investors that want to be in consumer health have an opportunity to buy in, while JNJ investors now get the pure play pharma/med tech company that they desire. The other issue that is creating some volatility is the court proceedings involving the settlement of the previous talc-based products case. A judge has rejected JNJs attempts to settle for now, however JNJ has already set aside close to $9 billion in awards for claimants.
ABT Re-Positions & Provides Increased Guidance
Abbott Labs (ABT), another top ten fund holding came out with Q2-23 results that beat street estimates on both the top and bottom lines. ABT has been focused on adjusting its business since the pandemic away from COVID testing and has seen significant success as core sales for the quarter totaled approximately $10 billion, with core sales up 11.5% (excluding COVID related testing). Strong results were led by medical devices, pharmaceuticals and nutrition. In Q2, medical device sales were up 14.2% to $4.3 billion led by growth in diabetes care. Sales of ABT’s FreeStyle Libre, the continuous glucose monitoring (CGM) system saw sales increases of 24.7% to $1.3 billion globally. The pharmaceutical business witnessed sales growth of over 5% to $1.3 billion while the nutrition division had 10% organic growth to $2.1 billion, led by a U.S. market share recovery in infant formula. ABT continues to innovate with new medical devices, and we see continued growth from the recent FDA approval of their Aveir leadless pacemaker system, a breakthrough in treating people with abnormal heart rhythms.
Abbott now projects full-year organic sales growth, excluding COVID-19 testing-related revenue, to be in the low double digits, an increased outlook versus the guidance provided when the company presented Q1-23 results. Due to the increased outlook, management has increased full-year adjusted EPS guidance to $4.90 from $4.50/share.
UNH Diversification Key to Continued Growth
United Health Group (UNH) is one of the behemoths in US health care. Its Q2 23 results illustrate continued stable growth as it continues to expand its service offering to both corporations and individuals. UNH combines its medical expertise and technology as it offers a range of health benefits to its various plan members. UNH management was cautious during the quarter discussing cost increases as demand for surgeries continues to increase. That led to some price pressure pre-Q2 release, however despite a higher medical care ratio of 83.2% vs last year at 81.5%, UNH still delivered strong results. For the quarter, revenues grew 16% YoY to $92.9 billion vs $80 bill in Q2 22; and 2% growth from Q1-23, while EPS reached $6.14 beating analyst estimates of $5.92. The company generated $72.5 billion in premium-related revenue in Q2, which was an increase of $8.6 billion YoY, however, medical costs rose by just under $8.2 billion, meaning that UNH still came in ahead after the rise in expenses and before factoring in revenue growth from its other segments. The diversification that UNH can rely on assists in absorbing higher medical costs while it generates non-medical revenues from the various acquisitions it has made over the last few years.
As a longer term investment, it is important to note that UNH revenues have increased every year since 2013, starting from $122.5 billion to $324 billion in 2022, an increase of 160%. In the long term, operating income has also seen similar increases growing from $9.6 to $28.4 billion in 2022 - up 195%. As a dividend payor, quarterly dividends have gone from $0.03 in 2010 to $1.88 in June 2023. It is for these reasons that UNH continues to be a solid holding for the Fund.
MERCK Inc Beats & Raises Guidance
Merck Inc. (MRK) announced a beat on their 2Q23 revenues and earnings with Q2 global sales reaching $15 billion vs consensus estimates of $14.4 billion. Sales growth was 3% YoY based on advances in its broad and deep pipeline of pharmaceuticals. Continued sales growth and additional clinical trials in the treatment of various ailments has established MRK as a continued leader in pharmaceuticals with years of drug development breakthroughs on the horizon. In Q2, KEYTRUDA treatment growth was 19% in Q2 to $6.3 billion, beating analyst estimates of $6 billion. Additional leadership growth was seen in GARDASIL 9 with sales of $2.5 billion, growing 47% in the prevention of genital and anal cancers, as well as mouth, throat, head and neck cancers in both women and men. In addition, MRK has multiple potential pipeline opportunities for growth with drugs such as Sotatercept (clinical development stage drug currently in Phase III for Pulmonary Arterial Hypertension; oral PCSK9 (clinical stage drug to lower cholesterol) and Vibostolimab (a cancer treatment that activates lymphocytes which help to destroy tumor cells) We continue to see strength in MRK as the company raised and its guidance for FYE 23 with revenue to $58.6-59.6 billion and EPS of $2.95-3.05.
Terrascend Pre Announces Strong Q2 Results
Terrascend Corp. (TSND) pre-announced Q2/23 revenues and gross margin, as well as provided the street with full-year positive guidance. Revenues in Q2 reached $72.1 million beating the consensus of $70.7 million, an increase of 12.7% YoY, and 3.9% QoQ. Also impressive was the company’s achievement on gross margin of 50.2%, up 200bps from Q1 48.8% and ahead of consensus of 48%. Encouraging for investors was the guidance provided by management for the balance of the year, establishing net revenue guidance of at least $305 million, well ahead of consensus at $298 million. Adding more support for its position in the Fund is the guidance on EBITDA from continuing operations of $58 million vs the current consensus of $56.2 million. These results underscore the unique operational footprint that TSND maintains with leadership in two US growth markets; New Jersey and Maryland. With limited licensing in NJ, TSND has a maximum 3 dispensaries in addition to establishing itself as one of the leading wholesale businesses in the state, which along with its exclusive relationship with COOKIES enables the company to make inroads on most shelves in the state. In Maryland, the recreational market just began July 1st and early sales figures are robust. TSND had previously built its cultivation and processing facility in Hagerstown in anticipation of the recreational market opening and is well positioned with the state's maximum 4 dispensaries, which were acquired in Q1 and Q2.
Option Strategy
Since the inception of the option writing program in September 2018, the Fund has generated significant income from options premium of approximately $4.82 million. We will continue to utilize our options program to look for attractive opportunities given the above average volatility in the sector as we strongly believe that option writing can continue to add incremental value going forward.
During the month we used our options strategy to assist in rebalancing the portfolio in favor of names we prefer while generating option income. We continue to write covered calls on names we feel are range bound near term and from which we could receive above average premiums which included Johnson & Johnson (JNJ), and Cronos Group Inc. (CRON). We also continue to write cash secured puts out of the money at strike prices that offered opportunities to increase our exposure, at more attractive prices, to names already in the Fund including Merck & Co. Inc. (MRK), HCA Holdings Inc. (HCA) and Eli Lilly and Co (LLY).
The Ninepoint Alternative Health Fund, launched in March of 2017 is Canada’s first actively managed mutual fund with a focus on the cannabis sector and remains open to new investors, available for purchase daily.
Charles Taerk & Douglas Waterson
The Portfolio Team
Faircourt Asset Management
Sub-Advisor to the Ninepoint Alternative Health Fund
Ninepoint Alternative Health Fund - Compounded Returns¹ as of July 31, 2023 (Series F NPP5421) | Inception Date - August 8, 2017
| MTD | YTD | 3MTH | 6MTH | 1YR | 3YR | 5YR | INCEPTION (ANNUALIZED) |
|
|---|---|---|---|---|---|---|---|---|
| FUND | -1.9% | -13.3% | -6.6% | -10.2% | -22.2% | -12.8% | -5.1% | 3.0% |
| TR CAN/US HEALTH CARE BLENDED INDEX | 6.4% | 12.0% | 2.8% | 4.3% | 8.4% | -11.3% | -12.4% | -5.7% |
Statistical Analysis
| FUND | TR CAN/US HEALTH CARE BLENDED INDEX | |
|---|---|---|
| Cumulative Returns | 19.2% | -29.6% |
| Standard Deviation | 27.4% | 29.3% |
| Sharpe Ratio | 0.0 | -0.2 |
1 All returns and fund details are a) based on Series F units; b) net of fees; c) annualized if period is greater than one year; d) as at July 31, 2023. The index is 70% Thomson Reuters Canada Health Care Total Return Index and 30% Thomson Reuters United States Healthcare Total Return Index and is computed by Ninepoint Partners LP based on publicly available index information.
The Fund is generally exposed to the following risks. See the prospectus of the Fund for a description of these risks: Cannabis sector risk; Concentration risk; Currency risk; Cybersecurity risk; Derivatives risk; Exchange traded fund risk; Foreign investment risk; Inflation risk; Market risk; Regulatory risk; Securities lending, repurchase and reverse repurchase transactions risk; Series risk; Specific issuer risk; Sub-adviser risk; Tax risk.
Ninepoint Partners LP is the investment manager to the Ninepoint Funds (collectively, the “Funds”). Commissions, trailing commissions, management fees, performance fees (if any), and other expenses all may be associated with investing in the Funds. Please read the prospectus carefully before investing. The indicated rate of return for series F shares of the Fund for the period ended July 31, 2023 is based on the historical annual compounded total return including changes in share value and reinvestment of all distributions and does not take into account sales, redemption, distribution or optional charges or income taxes payable by any unitholder that would have reduced returns. Mutual funds are not guaranteed, their values change frequently and past performance may not be repeated. The information contained herein does not constitute an offer or solicitation by anyone in the United States or in any other jurisdiction in which such an offer or solicitation is not authorized or to any person to whom it is unlawful to make such an offer or solicitation. Prospective investors who are not resident in Canada should contact their financial advisor to determine whether securities of the Fund may be lawfully sold in their jurisdiction.
The opinions, estimates and projections (“information”) contained within this report are solely those of Ninepoint Partners LP and are subject to change without notice. Ninepoint Partners makes every effort to ensure that the information has been derived from sources believed to be reliable and accurate. However, Ninepoint Partners assumes no responsibility for any losses or damages, whether direct or indirect, which arise out of the use of this information. Ninepoint Partners is not under any obligation to update or keep current the information contained herein. The information should not be regarded by recipients as a substitute for the exercise of their own judgment. Please contact your own personal advisor on your particular circumstances. Views expressed regarding a particular company, security, industry or market sector should not be considered an indication of trading intent of any investment funds managed by Ninepoint Partners. Any reference to a particular company is for illustrative purposes only and should not to be considered as investment advice or a recommendation to buy or sell nor should it be considered as an indication of how the portfolio of any investment fund managed by Ninepoint Partners is or will be invested. Ninepoint Partners LP and/or its affiliates may collectively beneficially own/control 1% or more of any class of the equity securities of the issuers mentioned in this report. Ninepoint Partners LP and/or its affiliates may hold short position in any class of the equity securities of the issuers mentioned in this report. During the preceding 12 months, Ninepoint Partners LP and/or its affiliates may have received remuneration other than normal course investment advisory or trade execution services from the issuers mentioned in this report.
Ninepoint Partners LP: Toll Free: 1.866.299.9906. DEALER SERVICES: CIBC Mellon GSSC Record Keeping Services: Toll Free: 1.877.358.0540
Investment Team


Related Funds
Historical Commentary
- Alternative Health Fund 12/2023
- Alternative Health Fund 11/2023
- Alternative Health Fund 10/2023
- Alternative Health Fund 09/2023
- Alternative Health Fund 08/2023
- Alternative Health Fund 06/2023
- Alternative Health Fund 05/2023
- Alternative Health Fund 04/2023
- Alternative Health Fund 03/2023
- Alternative Health Fund 02/2023
- Alternative Health Fund 01/2023
Toronto, Ontario M5J 2J1 Canada