Ninepoint Fixed Income Strategy
November 2023 Commentary
Monthly commentary discusses recent developments across the Ninepoint Diversified Bond, Ninepoint Alternative Credit Opportunities and Ninepoint Credit Income Opportunities Funds.
Summary
- Interest rates have peaked for this cycle.
- Investors collectively believe Central Bankers will achieve a soft landing and start cutting interest rates in the first half of 2024.
- The global economy is slowing, vulnerabilities are starting to appear, and Central Banks are keen to avoid the mistakes of the 1970s. We believe they will keep rates higher for longer, until something cracks.
- We expect a slowing economic environment and subsequent risk-off phase of lower rates and wider credit spreads, particularly in highly leveraged firms. Our funds are positioned accordingly.
Macro
Following the fastest and steepest rate hike cycle since the 1980s, many, us included, expected the North American economy to decelerate meaningfully this year, and possibly enter a recession. This has obviously not happened yet, GDP growth in the U.S. for the third quarter was a whopping 5.2%. Although, here in Canada, things have slowed down more meaningfully, with Q3 GDP coming at -1.4%. For all intents and purposes, GDP in Canada has not grown for the better part of this year. So far we have avoided outright recession, but it’s getting close.
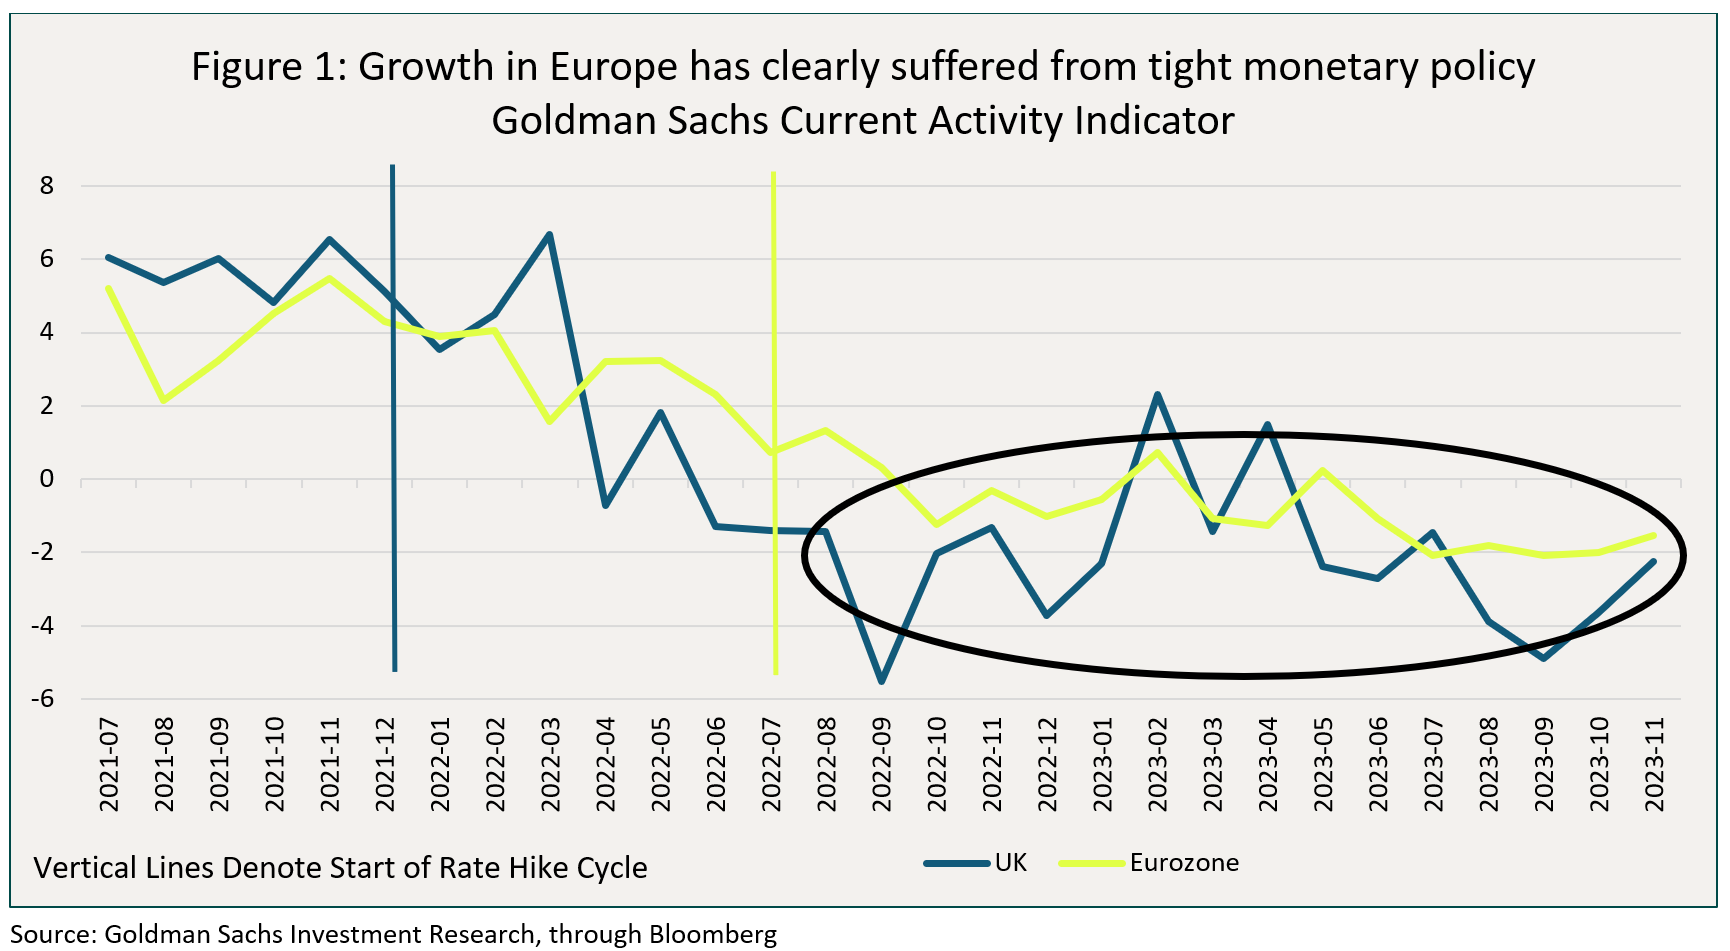
Across the pond, the Eurozone and UK economies have been very weak. Many Eurozone countries have reported several quarters of zero or negative growth (most notably Germany). Figure 1 below shows the Goldman Sachs Current Activity Indicator, a high frequency composite measure of growth, along with an indicator for the start of the rate hike cycle, for both the UK and the Eurozone. Clearly, monetary policy has had the intended effect there, with growth slowing notably for the past 18 months.
So, why has the Canadian, but more so, the U.S. economy, been so resilient to this fast and furious rate hike cycle? Looking at the composition of growth, two main themes emerge. First, consumers have kept on spending, sometimes even more than they earn. How so? Credit card borrowing in the U.S. is at all time highs, even with credit card rates also at all time highs. With banks tightening lending standards very aggressively and overall loan growth slowing rapidly, we expect consumers will find it much harder to keep spending at the current pace. Pandemic era savings were also a boost to spending this year, but most of the analysis we’ve read from the Fed and private economists, suggests that this might finally be done, meaning excess savings won’t be available to supplement consumption in excess of earnings. The exhaustion of excess savings might have started to bite, we are already observing increases in delinquency rates for consumer credit (auto and cards mostly), suggesting that the reality of higher rates is impacting activity.
Government spending has been another contributor to growth. Particularly in the U.S., but also to some extent Canada, where governments continue to run large deficits (Figure 2 below). It is particularly egregious in the U.S., where their government deficit is expected to come in at 6.2% of GDP this year and remain above 6% for the foreseeable future. Deficits of this magnitude are only typically seen in times of war or recession (Figure 2).
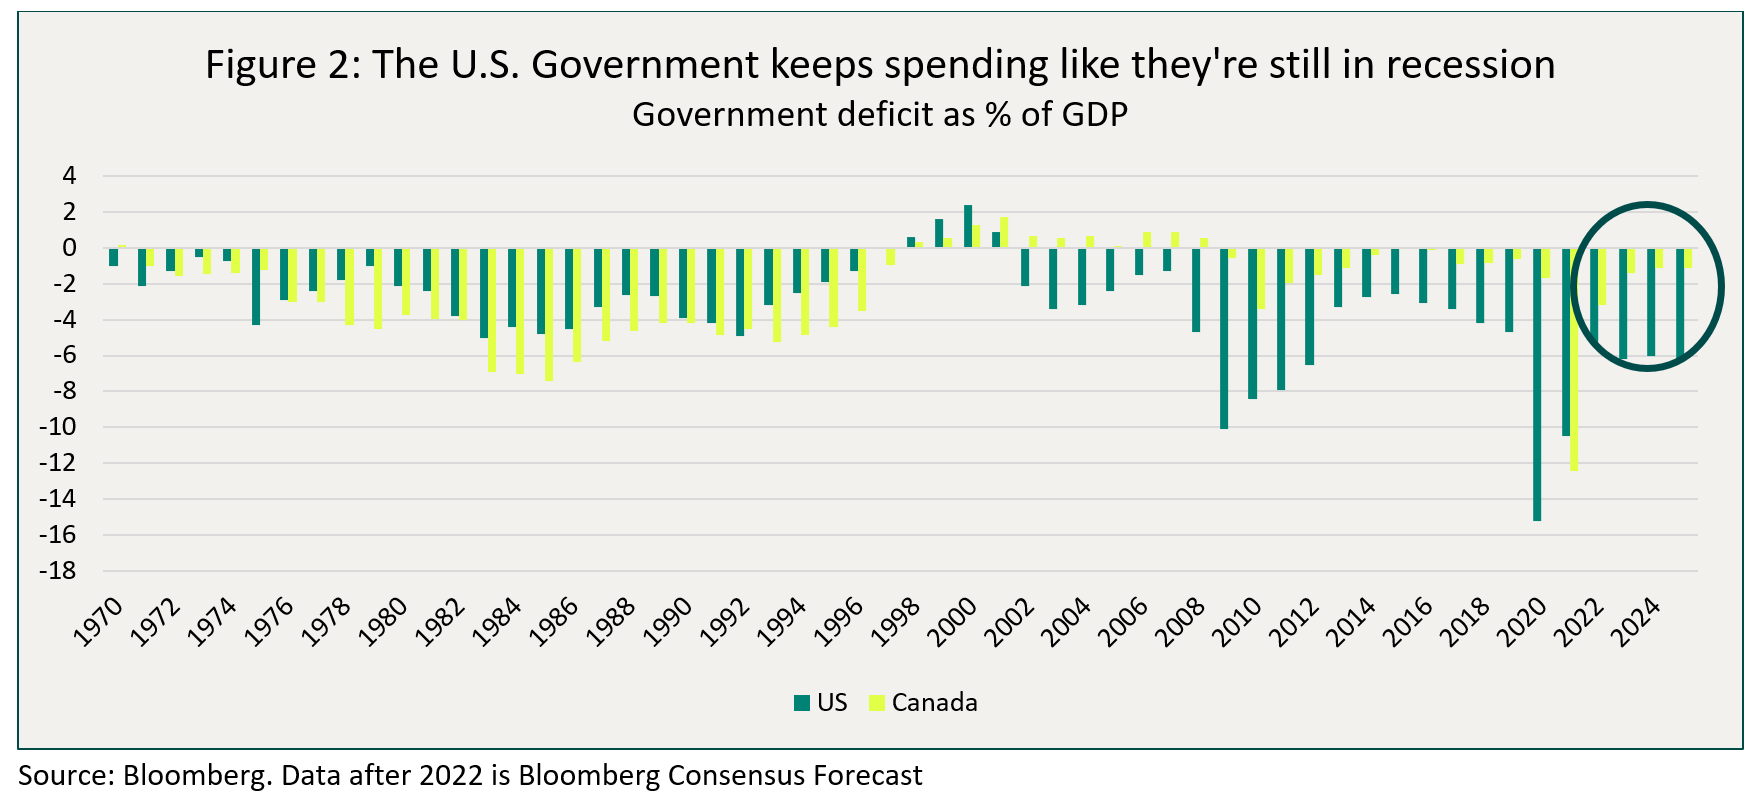
We are entering an election year in the U.S., and with a divided government and slim margins on both majorities in the House and the Senate, we suspect that it will be much harder for the Biden administration to push through another large spending bill in 2024. Therefore, we would expect the impulse to growth from government spending to turn from positive to negative next year.
So, the growth backdrop in North America, while it has remained more resilient than Europe in 2023, is set to slow in 2024. The tailwinds that supported outsized growth this year look to fade, or even become headwinds. The cost of higher rates is making its way through the economy, and past debt excesses are starting to hurt consumers and businesses (something that has happened much faster in Europe). The labour market has softened considerably from the tights of the pandemic, but still remains reasonably healthy. The unemployment rate is still relatively low (though well off the lows), and wages haven’t meaningfully declined. We believe that this is the function of two factors. First, businesses have had such a hard time finding workers post pandemic, that they are, to some extent, still hoarding some employees, for fear of not being able to replace them. Also, this transition takes time. Look at the large Canadian banks as a microcosm of this phenomenon. Earnings growth has been a challenge all year, first it was margins and revenue growth, then expenses were too high, and now finally provisions for bad loans are also going up. They have to act. And what is the fastest way to restore profitability when revenues and gross margins fall? Cut expenses. And that usually means cut headcount. We expect this trend to continue as growth slows further in 2024.
There was some significant progress in lower inflation in 2023. It is well off the highs experienced in 2021, but with core inflation still in the 3% range, it is still too high for central banker’s comfort. Given the passage of time and the continued softness in the economy, we expect inflation will continue to slowly drift lower. But barring a full-blown recession, the progress back to 2% will be very slow. Even with the progress made on inflation to date, both the Fed and BoC felt like they needed to keep hiking rates this year, increasing their overnight rate by 100 and 75bps, respectively. As they have said all along, the risks of doing too little outweigh the risks of doing too much. They remember very well the experience of the 1970s, when premature rate cuts in the late 1960 set the stage for the hyper-inflation of the 70s. At its December meeting, the BoC reiterated that inflation remains too high, and that they are prepared to hike again if progress is too slow. Similarly, the Fed, who hasn’t hiked since July, remains on hold, but still keeps the possibility of further rate hikes alive. Therefore, we believe that they are strongly inclined to drag their feet and leave rates at terminal for an extended period of time. Given the softness in the economy and the progress achieved on the inflation front, we firmly believe that both central banks (the ECB/BoE as well) are done with rate hikes for this cycle. Although, relative to the market, we believe rates are higher for longer. The main question now becomes: when in 2024 will they start to cut, and by how much?
The current market consensus is extremely optimistic on rate cuts. The market has decided that a soft landing is the most plausible outcome. All assets have rallied strongly since the end of October, with the view that the Fed has won the inflation fight without triggering a recession, and that rate cuts will be here shortly, allowing the economy to pick up. The futures market is now pricing-in 6 cuts by the Fed by Jan 2025, and 4 by the BoC by Oct 2024. This is either too aggressive (i.e. higher for longer/soft landing), or not aggressive enough (i.e. recession). We still think that recession is the most likely scenario for 2024, Table 1 below presents our expectations for rates and credit, in either scenario.
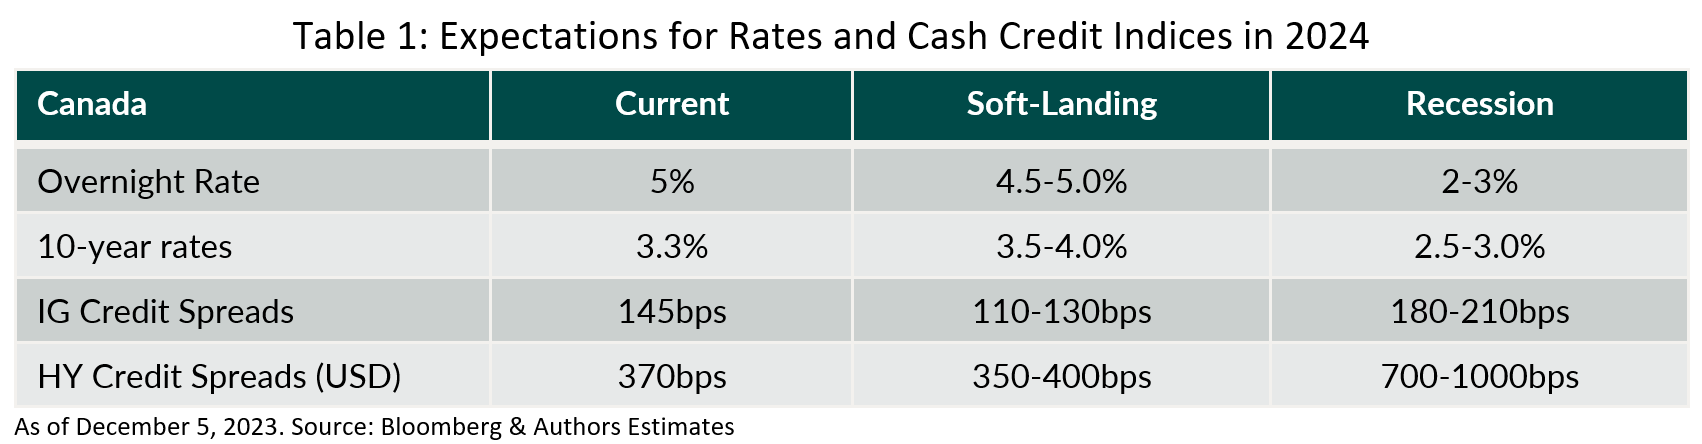
In a soft-landing scenario, where inflation drops closer to target later in 2024, we expect the BoC would venture to cut rates maybe 25-50bps, towards the end of the year, after an extended period on hold. In that context, we would expect long term rates to remain in the recent range. Under this higher for longer, soft landing scenario, we would expect credit spreads to keep grinding tighter from here, but not by a lot (15-35bps).
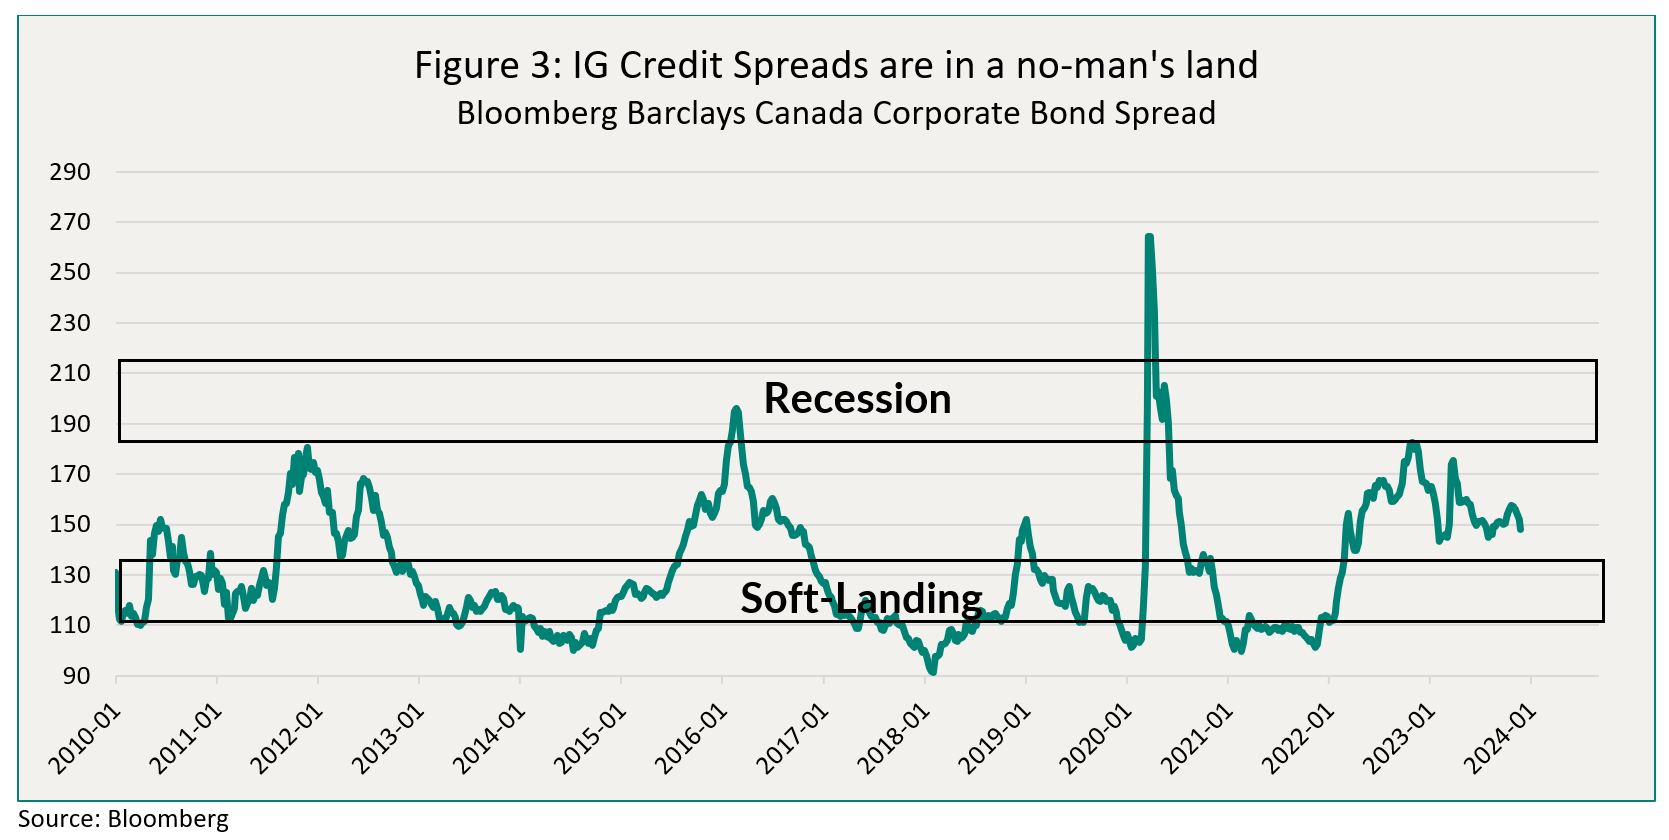
Alternatively, in a recession scenario, expect central banks to cut rates by 200-300bps, in line with previous downturns (outside of COVID or the GFC). In such a context, we would also expect the 10- and 30-year government bond yields to rally, perhaps by another 30-80bps, which would re-steepen the yield curve. In credit, IG spreads widening to about 180 to 200bps is consistent with past recessionary episodes (see Figure 3 below), while for high yield, usually in difficult economic environments, we tend to see spreads in the 700 to 1000bps range, so about double from where they are now (Figure 6 below in the text puts HY spread in historical context).
With this macro backdrop and these scenarios in mind, how are the funds positioned for the environment, and what should one expect as 2024 unfolds?
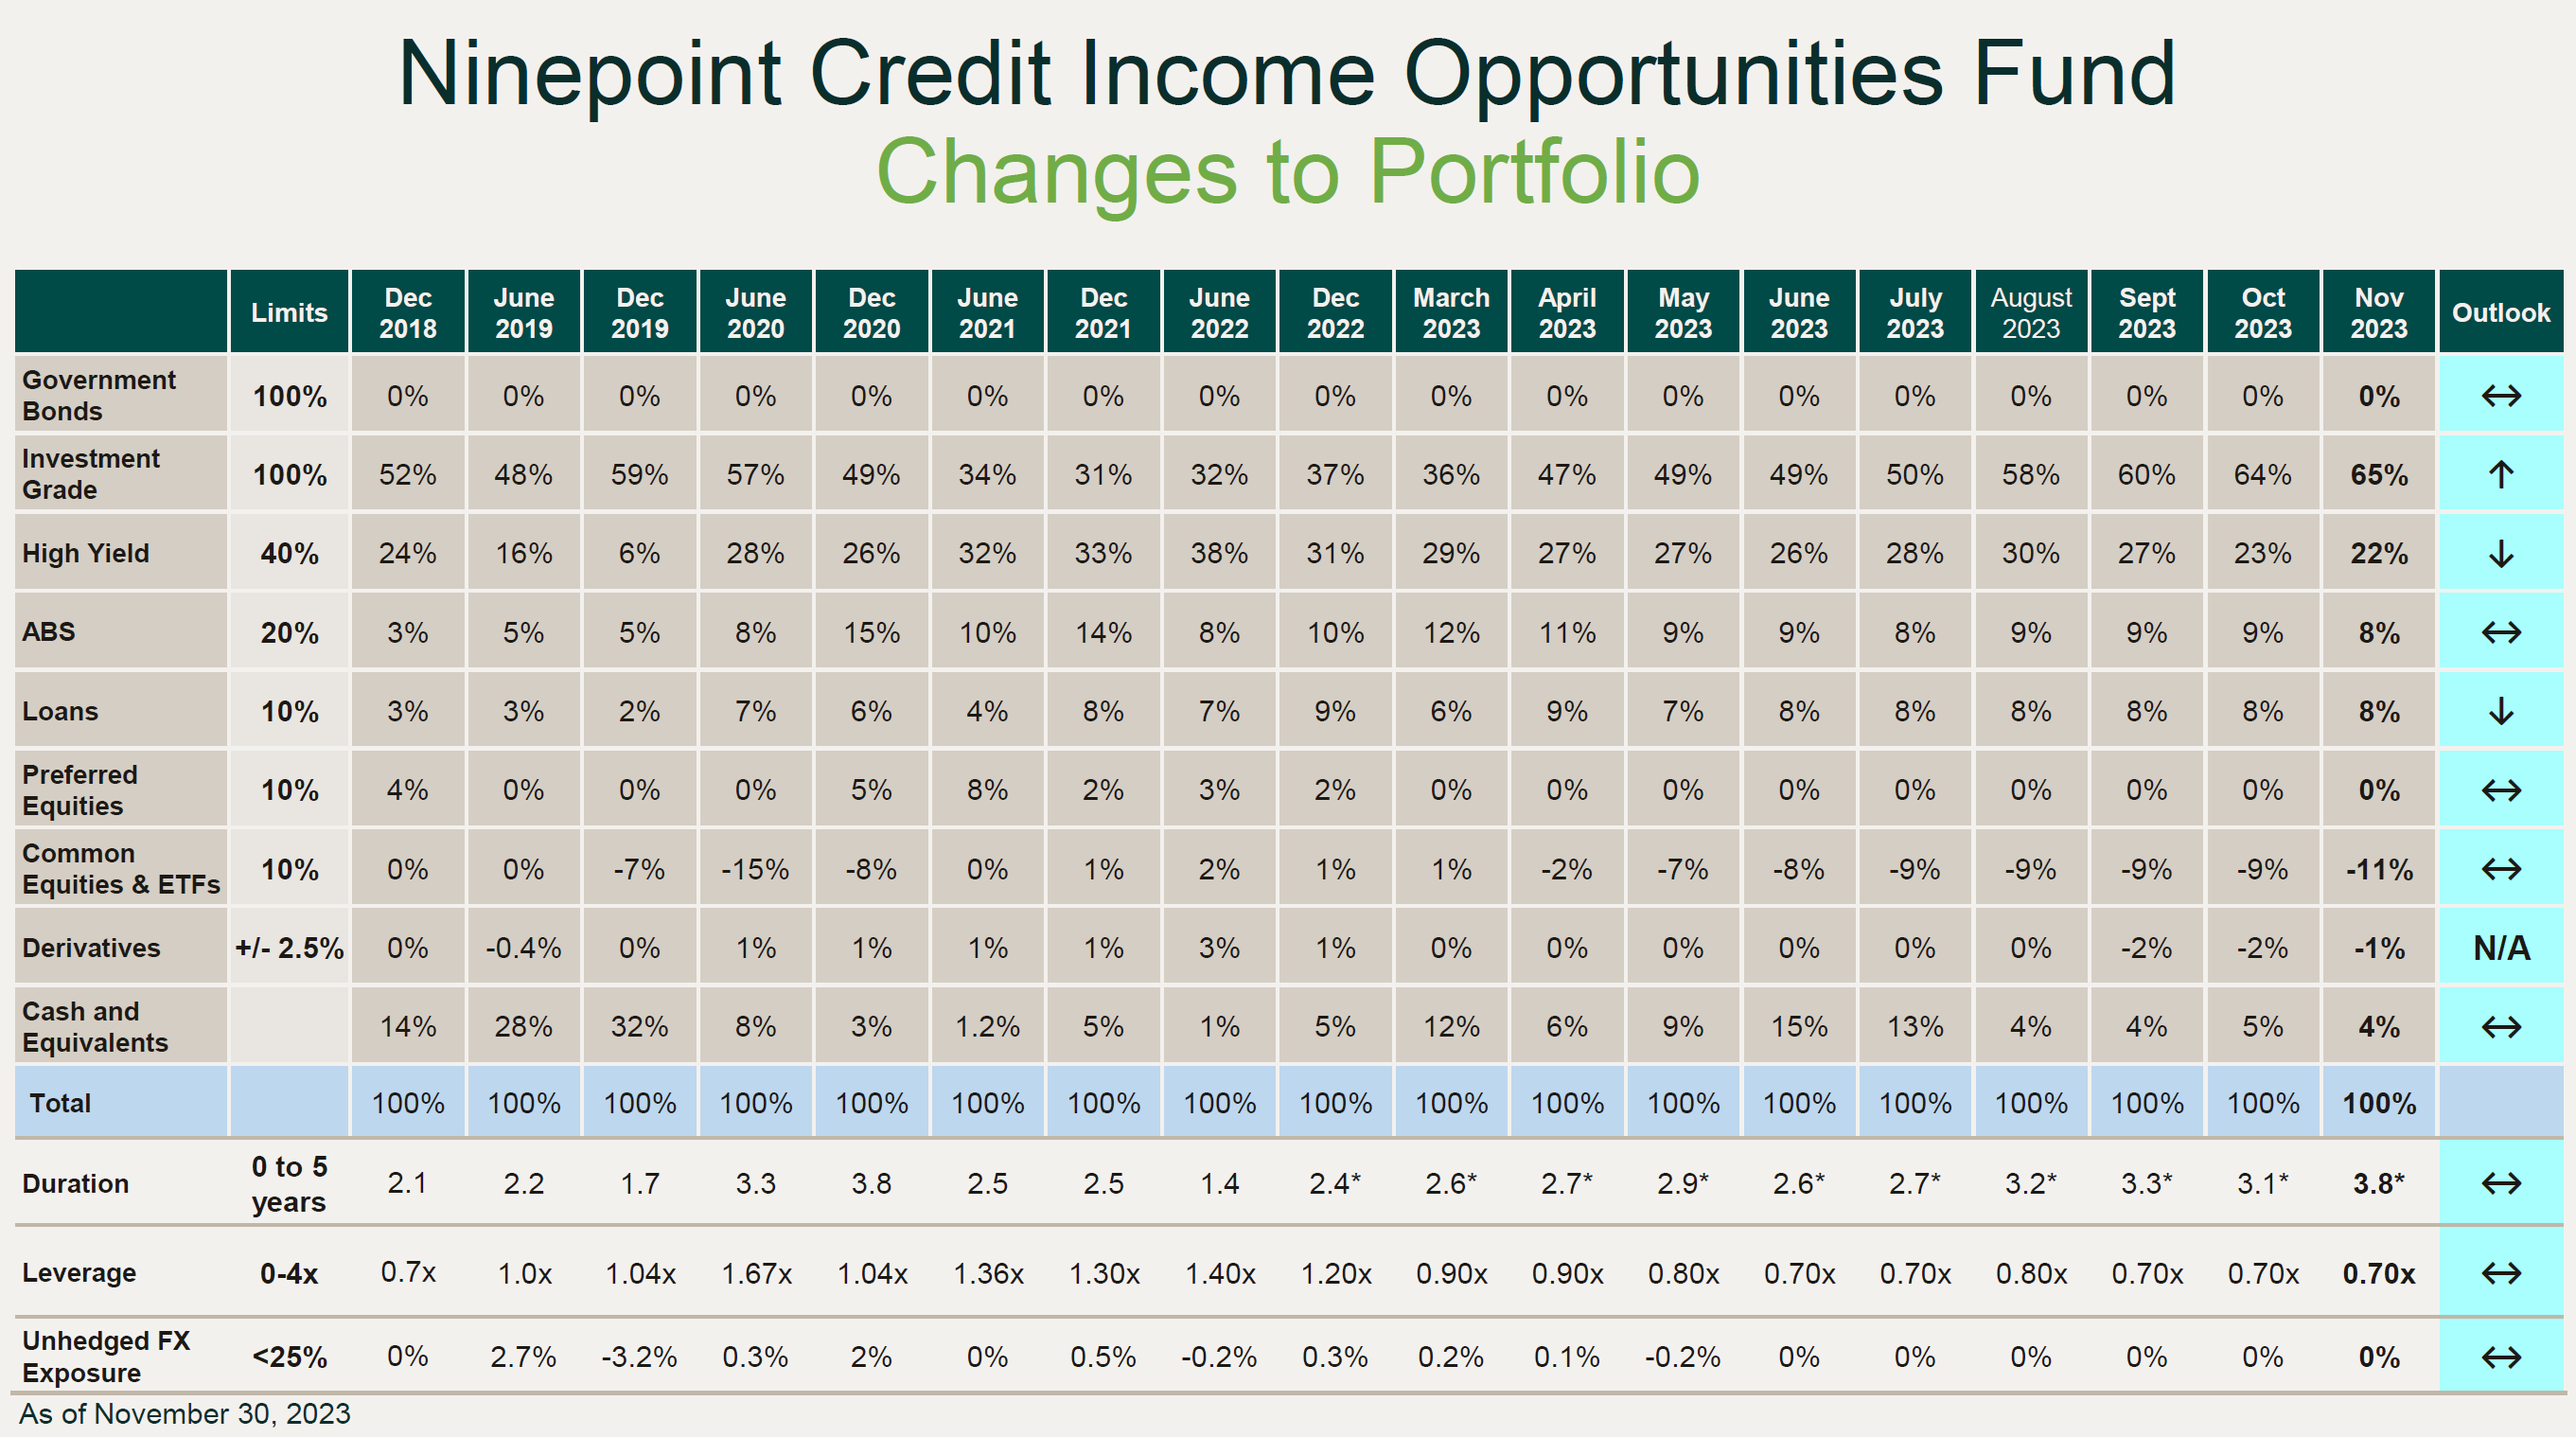
Fund Positioning: Defensive
As we are in the home stretch of 2023, we thought it would be helpful for investors to get some granularity on our fund’s positioning for next year. We have been in a defensive mode for most of the year. As we enter the last innings of the economic cycle, before central banks start cutting rates, the yield curve is fully inverted (short term rates are higher than long term rates) and risk assets (credit and equities) are at their most vulnerable point. It is hard to get the timing exactly right, for both rate cuts and risk assets selling off. Therefore, we try to position the portfolios in a comfortable waiting stance: maximize yield while pre-positioning for the eventual decline in interest rates and the widening of credit spreads. Below, we discuss in more detail the four main building blocks of the portfolios.
Building Block 1: Short-Term Credit for Low Volatility Carry
In our experience, with a fully inverted yield curve, the best place to harvest maximum yield with the lowest possible volatility is short-term (1-3 years) Investment Grade (or high-rated High Yield) corporate bonds. This is an important anchor and the largest building block of our portfolios. Table 2 below shows high level characteristics of this first building block as of November 30, 2023.
For example, the Diversified Bond Fund (DBF) currently has a 77% weight in short-term corporate bonds, which have an average duration of only 1.4 years, a current (cash) yield of 4.1% and a yield-to-maturity of 6.4%. For the Alternative Credit Opportunities (NACO) and Credit Income Opportunities (Ops), the characteristics of our short-term corporate bonds are broadly similar, but because of the leverage in the funds, we simply own more of it (161-167%). These are, on average, high-quality bonds, with a composite credit rating of A-.
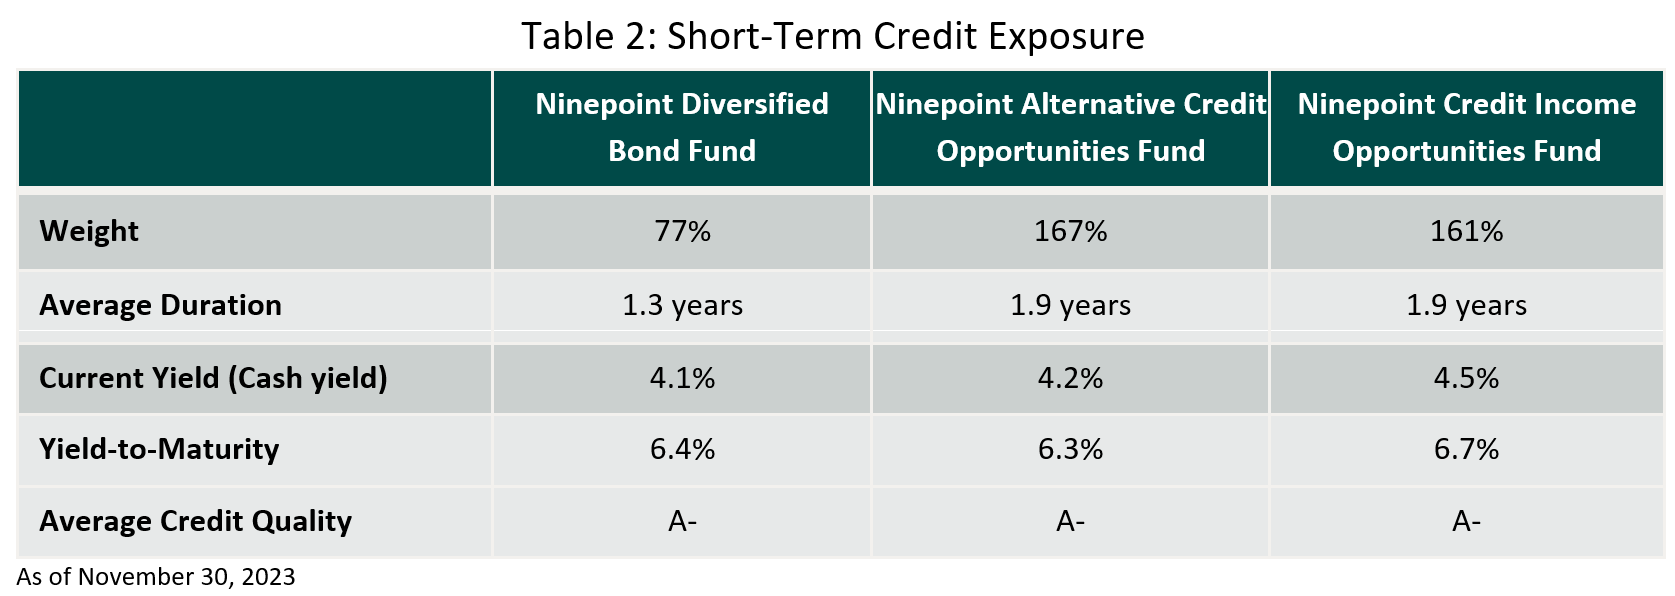
Regular readers of our commentaries will recognize the difference between the current and yield to maturity of these positions. That is because we have been actively prioritizing discount bonds in the portfolios, for tax efficiency. So with between 1.3 and 1.9 years of duration, those corporate bonds will “earn their carry in a tax efficient way” while exhibiting very little volatility. Why? Because, unless a company defaults, its bonds mature at par ($100). And the closer a bond is to maturity, the stronger the pull to par.
Here's an example of a bond we own. BMO 2.88 09/17/29, callable in September 2024 (banks always call those bonds, even in the depths of the GFC or the pandemic), with a yield to maturity of 6.1% and a current yield of 2.9%. So, for just under a year, we will earn 6.1% annualized, with 2.9% of it in income, and the rest in capital gains. The price chart of this bond is shown in Figure 4 below.
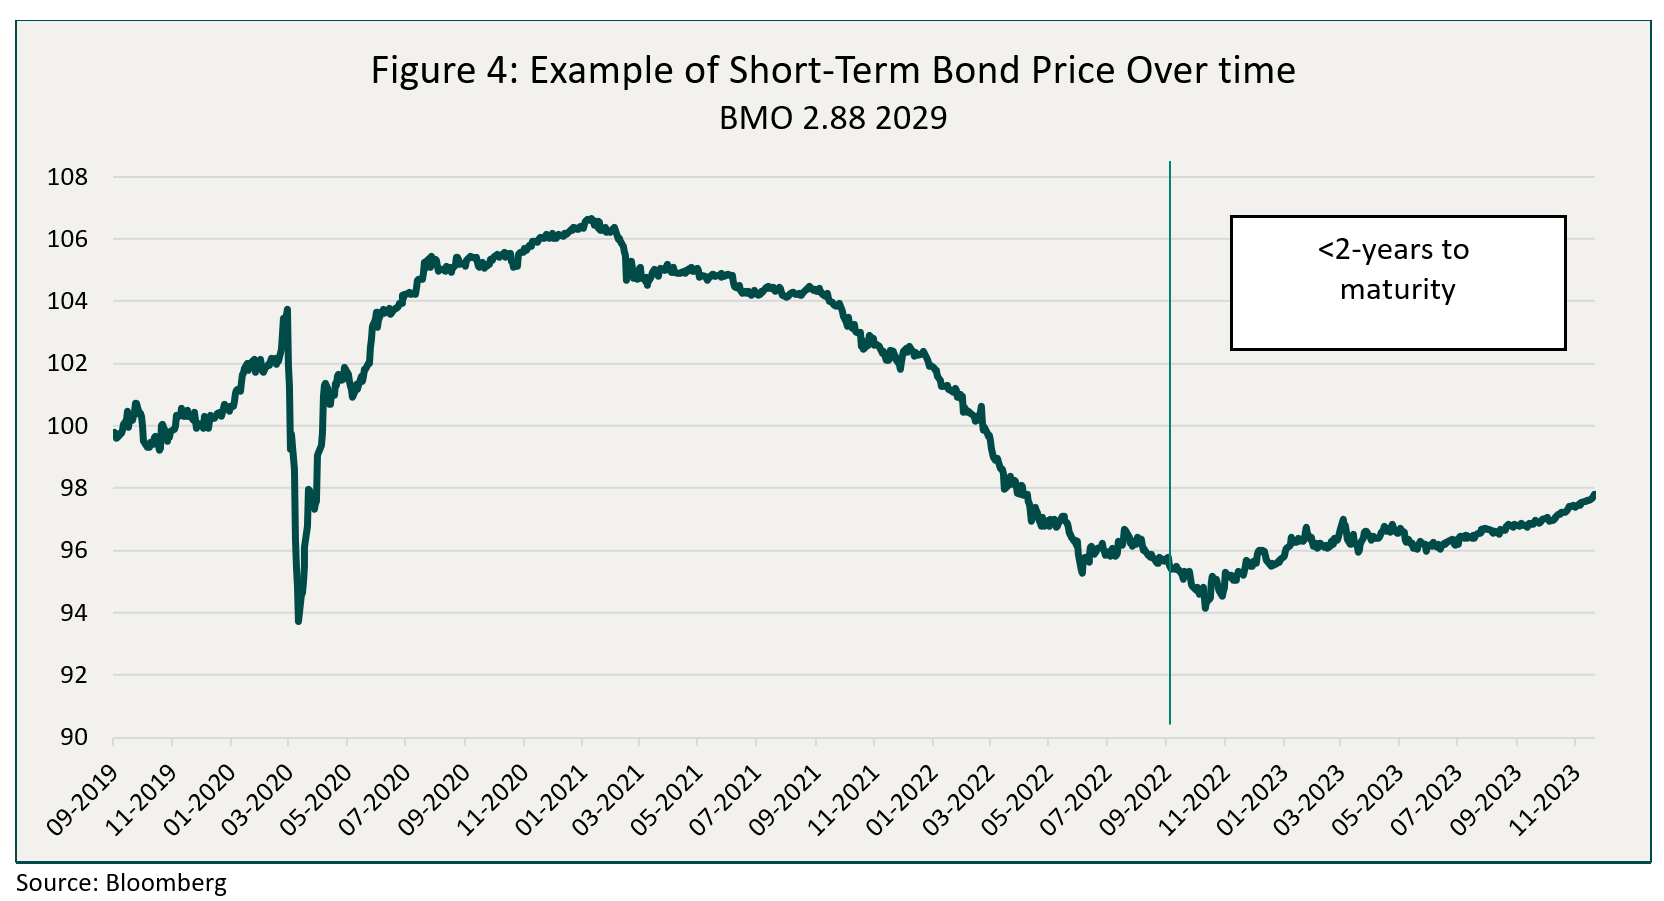
Because of its very low coupon, the rapid increase in interest rates and credit spreads we witnessed in late 2021 and 2022 were not kind to this bond, with the price rapidly declining from $106 to just $94 late last year. But notice how, even with the BoC increasing interest rates this year by 75bps, the price of this bond was very well behaved, and more recently, how it has smoothed out. That is pull to par at work, and our portfolios are full of examples like this one: high quality company, low coupon, and a short time to maturity. We see this as a great source of low-volatility yield, and that’s why this is the #1 building block across the funds.
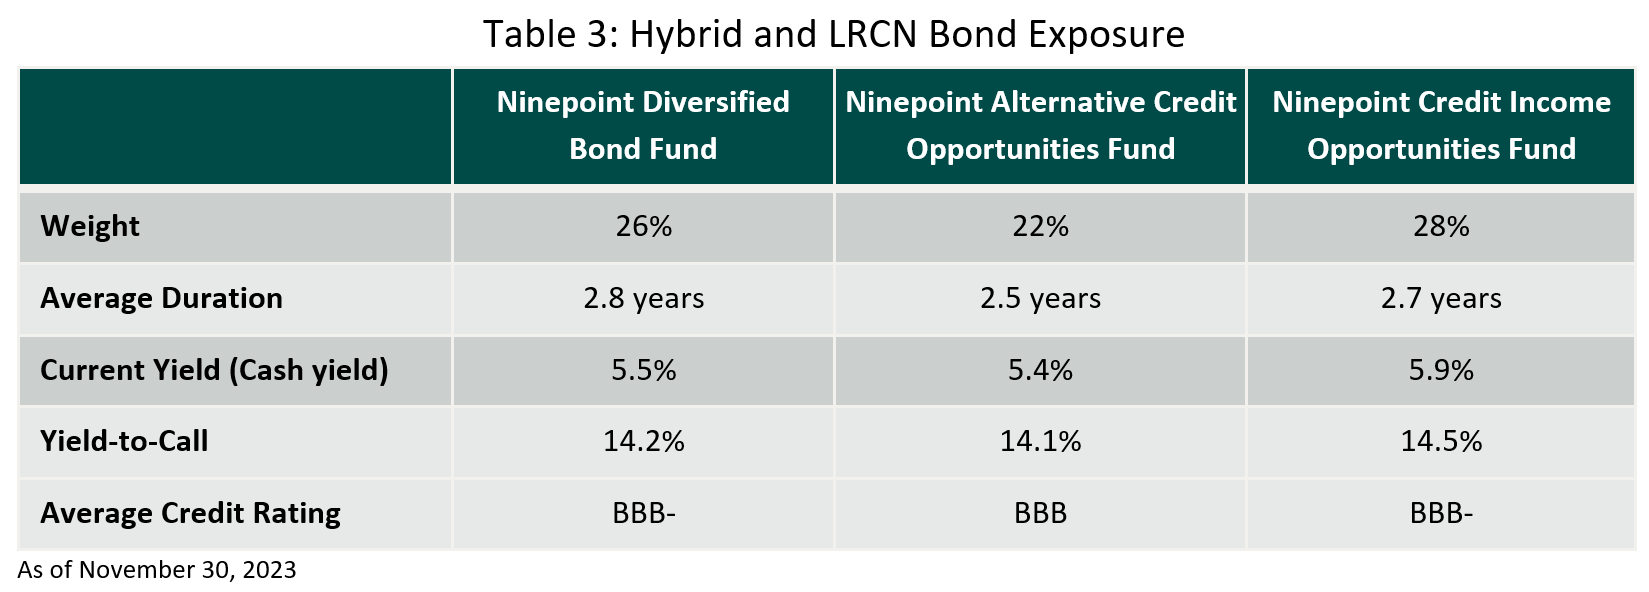
Building Block 2: Low Priced Hybrid Bonds and LRCN for Torque
Hybrid bonds and LRCN (Limited Recourse Capital Notes) are issued by investment grade companies, but because they rank lower in the capital structure, they either have a lower investment grade rating, or can sometimes end up with a high yield rating (average rating for our positions is BBB-). Table 3 below summarizes our exposure to this market segment. By design, we have focused on hybrid/LRCN bonds with low coupons and prices, because we believe they have the potential to generate substantial price upside. Hence the current yield of 5.5%-5.9% vs the yield-to-call of about 14%.
Here are two examples of hybrids/LRCN bonds we own, and why.
First off, TransCanada Pipelines, or TC Energy now. Their 2077 hybrid bond, with a coupon of 4.65% were issued in 2017. Hybrid bonds have value for companies because rating agencies assign them partial equity value, which in turn helps with their debt ratios. But, after their first call date (typically 5 or 10 years after issuance), they start to lose that equity value, giving issuers a very strong incentive to call them at that first call date. At a price of about $89 and a call date of May 2027, we find these TRP hybrid bonds very attractive. Their current yield is only 5.2%, but over the next 3.5 years, we will also make our way back to $100, from a $89 starting point, yielding 8.5% to call.
Another example of a low coupon/price security is TD 3.6% 2081. LRCN, by contrast to hybrids, do not lose equity value over their lifetime, so the decision to call them (they are callable every 5 years) is purely economic: could the bank issue a new LRCN in the market at a cheaper rate? Because of their very low coupon, they trade at a very low price, around $70, giving them a current yield of about 5.1%. Nothing to write home about. But the bank can call it (yield-to-call 17%), or let the coupon reset in October 2026, at a rate of 5-year Canada Bonds + 2.75%, which would be a coupon of about 5.9%, or a current yield of 8.4% at the current price. That is too high a current yield, versus what the bank could issue in the market, so we believe that the price will move higher, as we get closer to the call date. If not, we will own TD bank risk with an 8.4% cash yield. Not a bad outcome.
With a 22% to 28% weight in very low-priced, high-quality (average rating investment grade) hybrid and LRCN bonds, in the context of otherwise very defensive portfolios, we believe that we are maintaining exposure to a very cheap segment of the market, that will definitely enhance returns as we move closer to those call dates, with potential for nice price upside.
Building Block 3: Government Bonds for Ballast
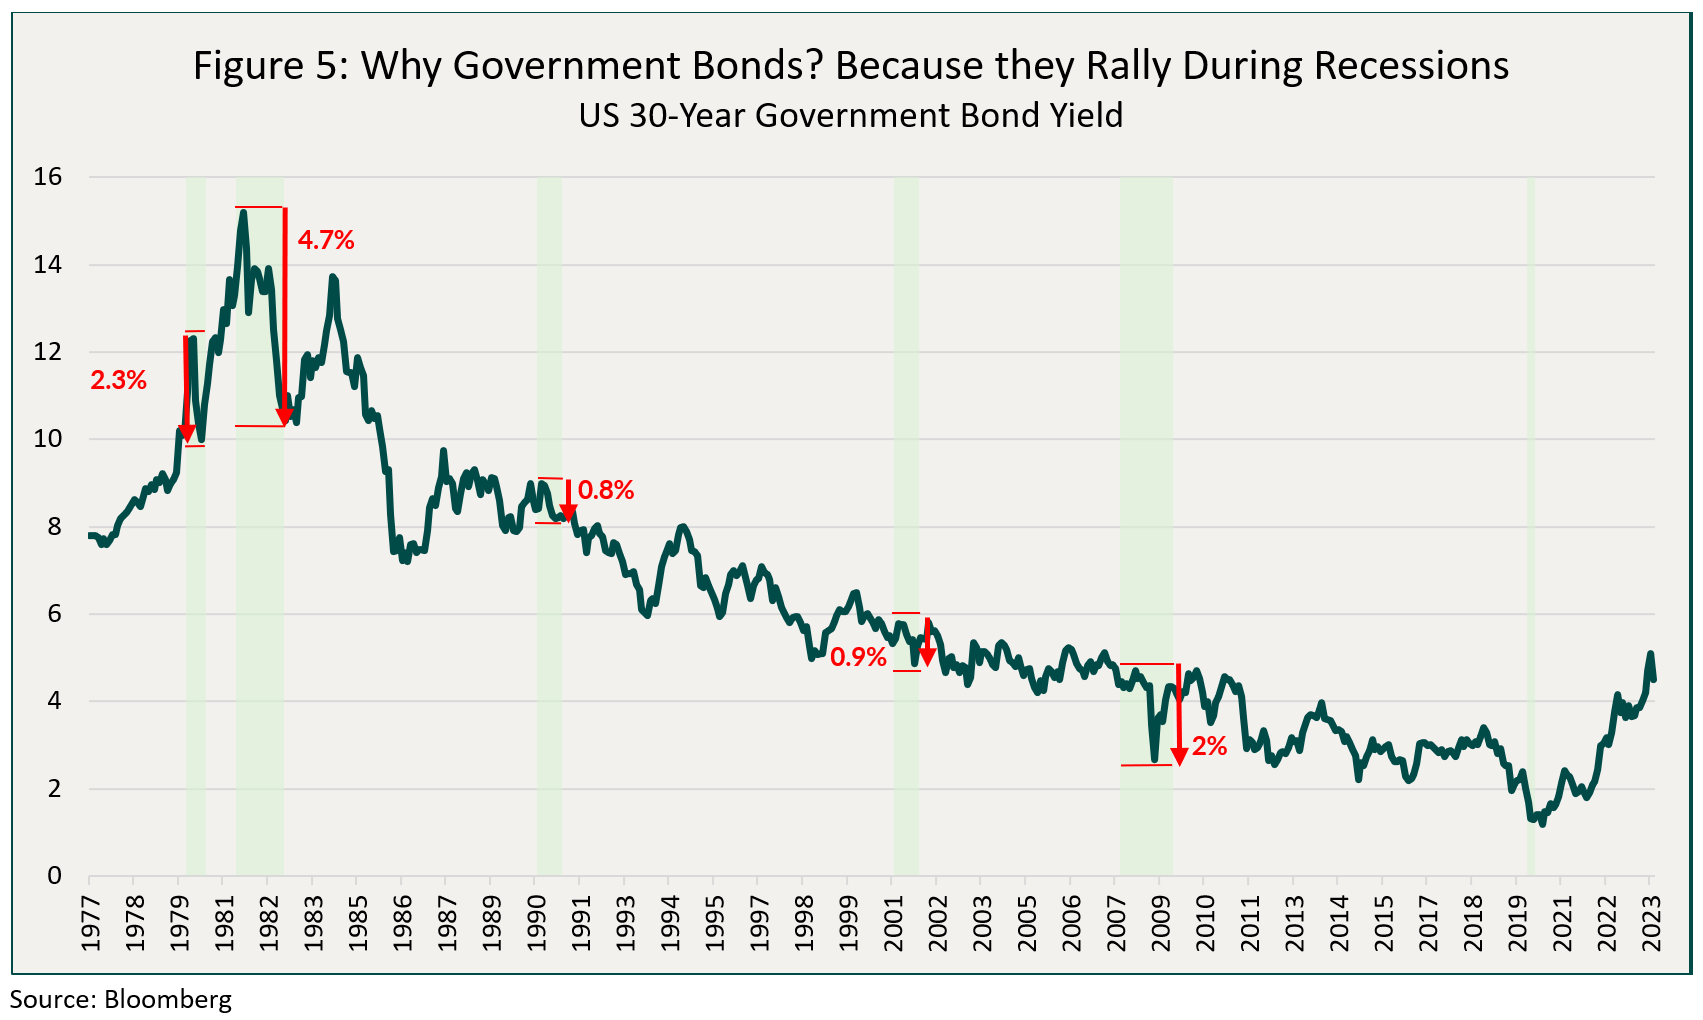
It is common knowledge that, in risk-off environments, there is a flight to safety, and investors typically converge towards long and intermediate term government bonds, with the expectation that longer-term interest rates will decline, and that they will realize capital gains on their 10 and 30-year government bonds. Figure 5 below puts this into perspective. We show the yield on the 30-year U.S. government bond, along with the net decline in the yield during recessions (shaded), from peak to trough.
The chart below illustrates this. Historically, in recession, long bonds yields rally in the range of 0.8% to 4.7%, with the largest declines in yield following the largest and steepest increases. We hold no crystal ball, but the most recent sell-off would certainly rival, from a historical perspective, the 1980s.
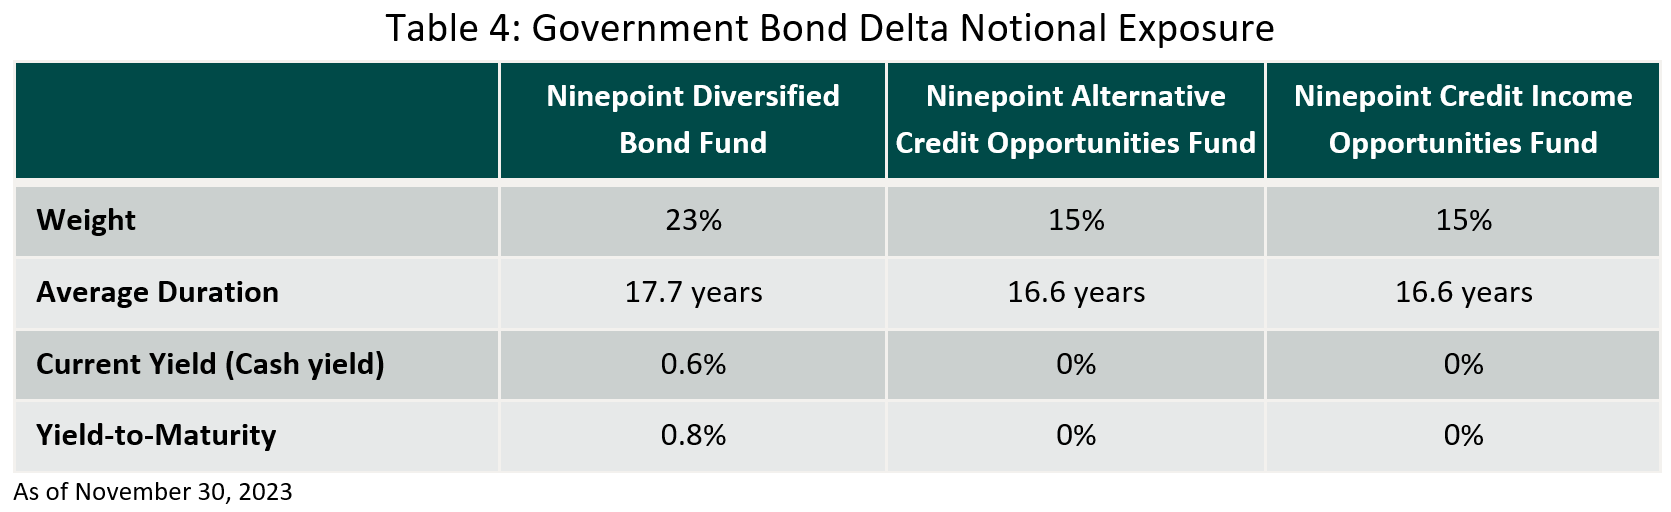
It should therefore be no surprise that long-term government bonds make up our 3rd portfolio building block. Table 4 below shows our current exposure to 30-year government bonds. It should be noted that in DBF, we own both US and Canada, whereas in the other two funds, we only own U.S. Government bonds. Our ownership of U.S. bonds is done synthetically, using options on the iShares 20+ Year Treasury Bond ETF. That ETF approximates the ownership of a 30-year US Treasury Bond very well. The portfolio weights below represent the net delta notional exposure of the funds to this ETF (i.e. the option position’s representation for small movement in the ETF itself).
Why use options, as opposed to buying 30-year Treasuries or the ETF outright?
1) Less impact on portfolio yield. Short-term credit yields a lot more than 30-year Treasuries do, so if we substituted our short-term corporate bonds for 30-year government bonds, we would sacrifice yield. This isn’t the case using options.
2) We “own” this TLT ETF by selling put options, and using the premium generated to buy call options. We always do it premium neutral (i.e. no net cost to the funds). The puts we sell are slightly out of the money, and so are the calls we buy. If TLT sells-off, like it did from August to October, those out of the money options afford us a margin of safety, vs outright ownership. Overall, this makes the position less volatile.
Therefore, consistent with prior end of economic and rate hike cycles, there can be significant upside from owning long-term government bonds, with the size of the rally typically commensurate with the severity of the recession or the sell-off that precedes it. A 100bps only takes us back to where we started August 2023, so this rally might still have legs.
Building Block 4: Short High Yield for More Ballast
All our funds have a credit focus. When we expect a slow down in the economic cycle, we like to hedge some of our credit exposure directly. High yield bonds, by definition, are issued by companies that carry more leverage or that have less stable business models. Already this year, we have seen HY default rates move higher, from the post pandemic lows of 2% to about 4%. Many sell side economists’, rating agencies’ and credit specialists’ models point to a further acceleration in default rates, possibly to 8%. Historically, when default rates increase by that much, HY credit spreads (Figure 6 below) are between 700 and 1000bps. Compare that with current spreads of only 400bps, and you see why we like being short HY as a hedge against our (primarily investment grade) credit.
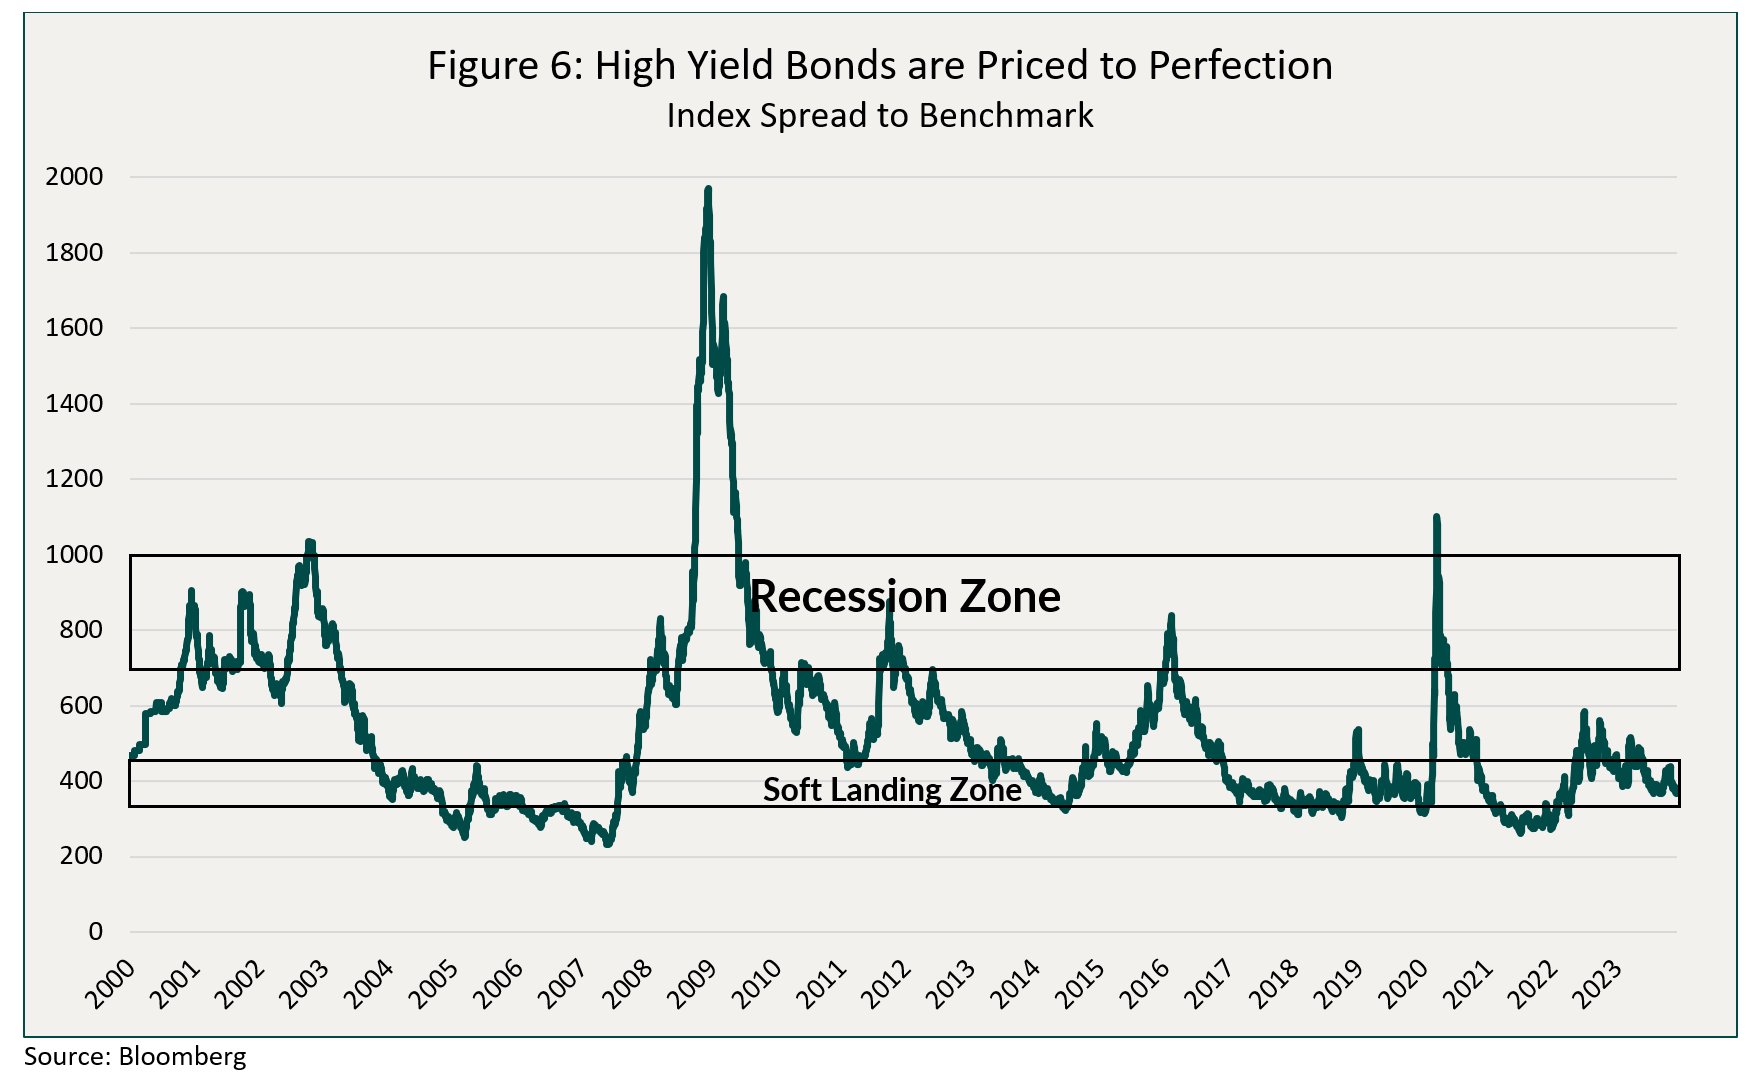
Across all our funds we have initiated a short position in high yield ETF’s, the DBF has a 7% short position (JNK and HYG, 3.8 years duration), and NACO and Ops are at 11/12%. Under our recession scenario, HY credit spreads could move 300-600bps wider, resulting in a price change of roughly -11% to -23% (3.8 years x 3% to 6%). This is not a forecast, but within the historical context, HY in a recession won’t trade with a 400bps spread.
Conclusion
Putting it all together our four building blocks construct portfolios that will:
1) Generate lots of low volatility income with tax efficiency.
2) Provide an upside to credit through our allocation to low priced hybrid and LRCN bonds without sacrificing quality,
3) Have significant exposure to long term US and Canadian government bonds, which will rally as the monetary cycle ends.
4) Have HY credit hedges to dampen volatility.
Over the last 18 months we have been moving the portfolios to this current stance, this hasn’t been an overnight decision. When the time comes, and we have done this before, we will go from Defensive to Opportunistic mode, acting from a position of strength, instead of fielding margin calls. This is the same playbook we followed in 2019/2020, and while every cycle is different, history always rhymes.
Until next month,
Mark, Etienne & Nick
Ninepoint Partners
Appendix: Portfolio Characteristics
1 All Ninepoint Diversified Bond Fund returns and fund details are a) based on Series F units; b) net of fees; c) annualized if period is greater than one year; d) as at November 30, 2023 1 All Ninepoint Credit Income Opportunities Fund returns and fund details are a) based on Class F units; b) net of fees; c) annualized if period is greater than one year; d) as at November 30, 2023. 1 All Ninepoint Alternative Credit Opportunities Fund returns and fund details are a) based on Class F units; b) net of fees; c) annualized if period is greater than one year; d) as at November 30, 2023.
The Risks associated worth investing in a Fund depend on the securities and assets in which the Funds invests, based upon the Fund's particular objectives. There is no assurance that any Fund will achieve its investment objective, and its net asset value, yield and investment return will fluctuate from time to time with market conditions. There is no guarantee that the full amount of your original investment in a Fund will be returned to you. The Funds are not insured by the Canada Deposit Insurance Corporation or any other government deposit insurer. Please read a Fund's prospectus or offering memorandum before investing.
Ninepoint Credit Income Opportunities Fund is offered on a private placement basis pursuant to an offering memorandum and are only available to investors who meet certain eligibility or minimum purchase amount requirements under applicable securities legislation. The offering memorandum contains important information about the Funds, including their investment objective and strategies, purchase options, applicable management fees, performance fees, other charges and expenses, and should be read carefully before investing in the Funds. Performance data represents past performance of the Fund and is not indicative of future performance. Data based on performance history of less than five years may not give prospective investors enough information to base investment decisions on. Please contact your own personal advisor on your particular circumstance. This communication does not constitute an offer to sell or solicitation to purchase securities of the Fund.
Ninepoint Partners LP is the investment manager to the Ninepoint Funds (collectively, the “Funds”). Commissions, trailing commissions, management fees, performance fees (if any), other charges and expenses all may be associated with mutual fund investments. Please read the prospectus carefully before investing. The indicated rate of return for series F units of the Fund for the period ended November 30, 2023 is based on the historical annual compounded total return including changes in unit value and reinvestment of all distributions and does not take into account sales, redemption, distribution or optional charges or income taxes payable by any unitholder that would have reduced returns. Mutual funds are not guaranteed, their values change frequently and past performance may not be repeated. The information contained herein does not constitute an offer or solicitation by anyone in the United States or in any other jurisdiction in which such an offer or solicitation is not authorized or to any person to whom it is unlawful to make such an offer or solicitation. Prospective investors who are not resident in Canada should contact their financial advisor to determine whether securities of the Fund may be lawfully sold in their jurisdiction.
The opinions, estimates and projections (“information”) contained within this report are solely those of Ninepoint Partners LP and are subject to change without notice. Ninepoint Partners makes every effort to ensure that the information has been derived from sources believed to be reliable and accurate. However, Ninepoint Partners assumes no responsibility for any losses or damages, whether direct or indirect, which arise out of the use of this information. Ninepoint Partners is not under any obligation to update or keep current the information contained herein. The information should not be regarded by recipients as a substitute for the exercise of their own judgment. Please contact your own personal advisor on your particular circumstances. Views expressed regarding a particular company, security, industry or market sector should not be considered an indication of trading intent of any investment funds managed by Ninepoint Partners LP. Any reference to a particular company is for illustrative purposes only and should not to be considered as investment advice or a recommendation to buy or sell nor should it be considered as an indication of how the portfolio of any investment fund managed by Ninepoint Partners LP is or will be invested. Ninepoint Partners LP and/or its affiliates may collectively beneficially own/control 1% or more of any class of the equity securities of the issuers mentioned in this report. Ninepoint Partners LP and/or its affiliates may hold short position in any class of the equity securities of the issuers mentioned in this report. During the preceding 12 months, Ninepoint Partners LP and/or its affiliates may have received remuneration other than normal course investment advisory or trade execution services from the issuers mentioned in this report.
Ninepoint Partners LP: Toll Free: 1.866.299.9906. DEALER SERVICES: CIBC Mellon GSSC Record Keeping Services: Toll Free: 1.877.358.0540


Related Funds
Historical Commentary
- Fixed Income Strategy 12/2023
- Fixed Income Strategy 10/2023
- Fixed Income Strategy 09/2023
- Fixed Income Strategy 08/2023
- Fixed Income Strategy 07/2023
- Fixed Income Strategy 06/2023
- Fixed Income - H1 2023 Market Review and Outlook
- Fixed Income Strategy 05/2023
- Fixed Income Strategy 04/2023
- Fixed Income Strategy 03/2023
- Fixed Income Strategy 02/2023
- Fixed Income Strategy 01/2023
Toronto, Ontario M5J 2J1 Canada